I don’t need to tell you how frustrating it can be to work hard on a blog post, infographic, podcast or SlideShare, only to notice later that it didn’t get as many shares as you would have hoped. Every content marketer has been there, especially when starting out.
Let’s say you publish an article on your blog that, in theory, should hit all the right notes: it’s over 1500 words long, it has relevant external links, it has an attention-grabbing title, it has high quality images, maybe it even has a few personal anecdotes thrown in.
You also know that publishing the article is only the first step and you’ve done some legwork to promote it. You’ve shared it to your social pages, you’ve sent out an email blast to your users. And it works! After a couple of days, you get a hundred social interactions. After a week, maybe even a couple hundred interactions. Everything seems to be in order.
Then you visit one of your go-to resources for all of your marketing insights and look at their most recent blog post. It has 2k shares and it’s only been up for a couple of days.
Bummer.
Before you get too discouraged, take this into consideration: how big is your audience?
Because if your audience is significantly smaller than many influential marketing tech companies, you might need to cut yourself some slack.
Don’t beat yourself up over not hitting the same numbers as the big guys. Your content might be doing better than you even realize. To see how well your content is actually performing, you need to normalize your shares.
Comparing shares for your content with a site that has a huge audience isn’t the most productive way to go about benchmarking your content. Of course their numbers will be higher. What you need to do is to look at how your posts are performing relative to the size of your audience. This is called normalizing your shares.
And no, this is not just a way to make excuses for low performance–it’s a way to be realistic. Once you know what numbers you should realistically be hitting for the size of your audience, you can set achievable and scaleable goals.
Go straight to the Infographic:
Normalize for accurate comparison
Here’s the cold hard truth: odds are that unless your site is one Inbound’s top 115 MarTech companies, your content won’t get even a fraction of the interactions that theirs do. That’s because content follows the power law: the amount of content that is shared and even read disproportionately favors only the top 10% of the best performing sites. The majority of content gets zero to thirty shares. So if your site isn’t in the top 10%, your content will go virtually unread.
But there is a silver lining to this truth. If your content has even a dozen meager social interactions, that means that it’s already performing better than the majority of online media out there. And if you’re a conscientious marketer, then you will probably average more than twenty social interactions per article. Chances are you’re already off to a good start.
How to Normalize Your Shares
There are three steps to this process:
- Collect your shares.
- Normalize your shares.
- Analyze your shares.
Collect your shares
It’s prudent to not only look at your total shares, but to also look at your shares separately by social media platform. This way, you can identify gaps in your social media strategy, to see which channels you need to work on.
Look at:
- Shares per post on Facebook, Twitter, LinkedIn, Instagram, Pinterest (anywhere you have a social presence, no matter how small)
- Blog shares per follower (this is where normalizing your numbers comes in)
- Types of blog posts and content (listicles, infographics, how-to guides, videos, podcasts and audio content etc. as well as content length)
Use a tool like BuzzSumo to collect metrics from over different periods of time. To create benchmarks, we looked at metrics for a six-month period and a single month period. These time periods will give you a better understanding of the patterns and trends of your content’s traffic.
Next, go to your social media pages and record how many followers you have on each.
Put these metrics into a spreadsheet.
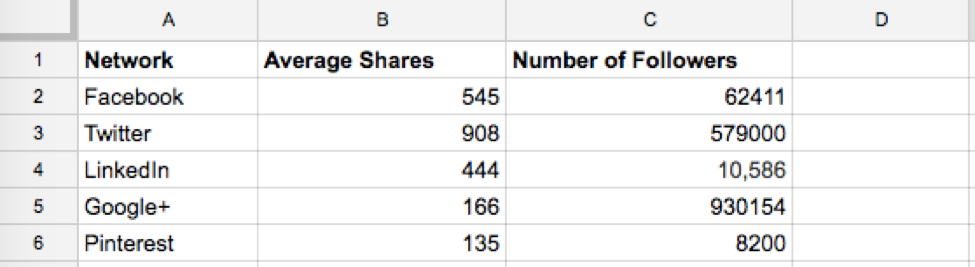
For example, here are the Buffer blog’s followers and shares over a six month period (July 1, 2015 – December 31, 2015).
Normalize your shares
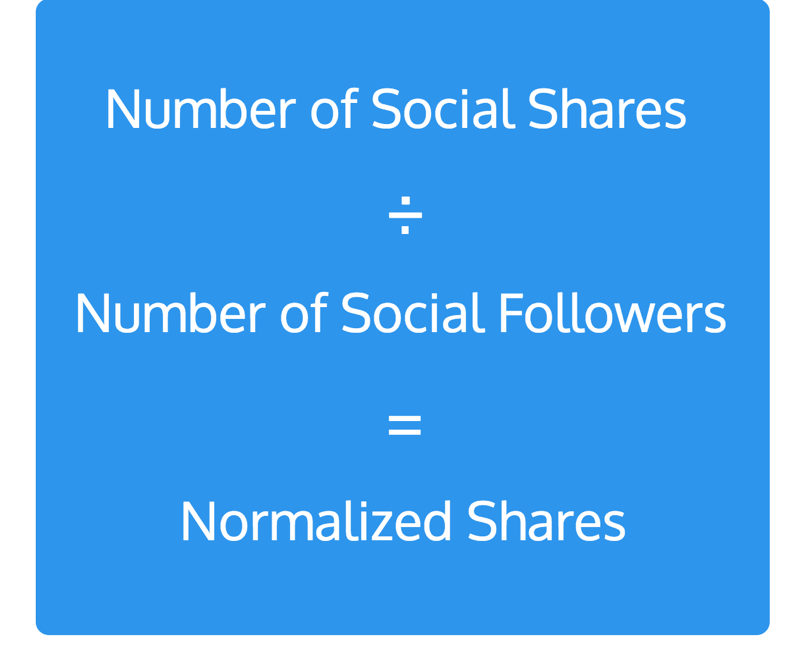
Normalizing your shares is very simple. Just divide the number of social shares on a blog post by the number of followers on that particular social media platform in order to get your normalized share percentage. This will tell you how engaged your audience is.
Returning to Buffer, consider their average Twitter shares per blog post over a six month period: 908. Not bad. But now, normalize those shares: 908/579,000 = 0.16%. That’s a very low rate of shares per follower.
Or take another another example: HubSpot, who have a very high average number of shares for each blog post. Over a six month period (July 1, 2015 – December 31, 2015) HubSpot published 1604 posts (the second highest post count of 115 companies).
Their average total shares over six months was 830 shares. That’s way higher than most other MarTech sites–an average of 166 shares per post on Facebook and 349 shares per post on Twitter. But considering their followers on Twitter and Facebook alone exceed 1.5 million, their normalized share count isn’t actually that high: 0.05% on Twitter and 0.015% on Facebook.
Now you’ve got some perspective.
Analyze your shares
Once you’ve normalized your shares on a month over month basis and on a multi-month basis, you can look for places where your content strategy can be improved.
Shares by Social Media Platform
Your analysis will reveal which platforms have a more engaged audience and which platforms you may need to target more.
For example, you might notice that your shares on Facebook are substantially lower than your shares on Twitter. This might cause you to look into your audience on Facebook and find a substantial community that you haven’t been targeting! Now you can adjust your content strategy to better target Facebook.
Average Shares by Content Type
Your analysis might reveal that certain type of content performs better than other forms of content–for instance, posts featuring infographics versus posts without data visualizations.
BuzzSumo’s Content Analysis tool allows you to look at the average shares per content type. Take a look at an analysis of Hootsuite blog’s content over a six month period.
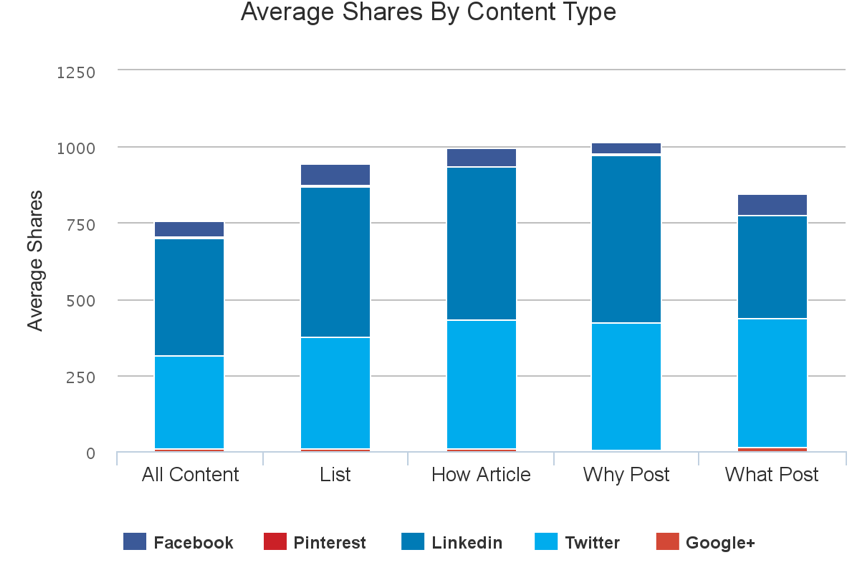
As you can see, “Why Posts” and “How Articles” are the most shares types of content–content that is actionable and explanatory.
Number of Shares Per Unique Page Views
Another way to slice and dice your information is to look at the number of shares per unique page views on a specific article, and on your articles over a period of time. This will give you another insight into how engaged your audience is, and what type of content 1) gets more views and 2) converts to shares. To get this metric, you can use Google Analytics.
For example, take a look at this sample from BuzzSumo’s blog:
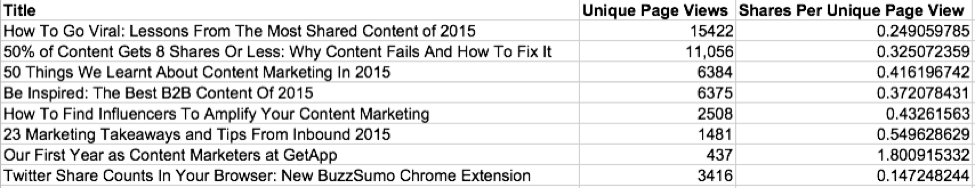
As you can see from this sample, more page views does not necessarily denote more shares. The article titled “Our First Year as Content Marketers at GetApp” has the lowest number of unique page views but by far the greatest number of shares per unique page views. This means that the audience that did view the article, despite being smaller than the rest, were far more engaged.
Once you see which posts had the greatest audience engagement via shares per unique page view, you can cross-examine the post’s traffic and break the metrics down by post type and by normalized shares per social media page.
When analyzing your metrics, it can be helpful to visualize your findings. Because I’m a visual learner, I find that visualizing data helps me find patterns and draw connections. Visualizing your data is easy if you use a simple chart maker.
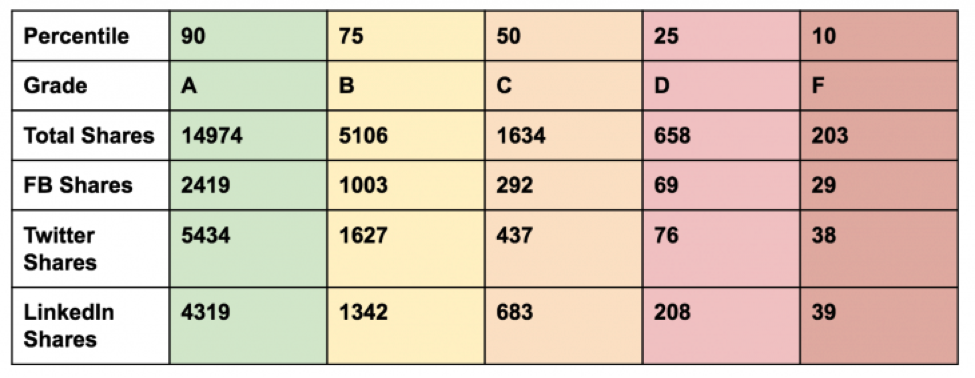
Benchmarks for Shares on All Networks
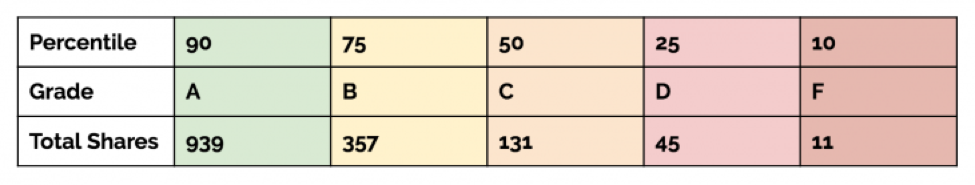
Here are benchmarks for content shares, based on an analysis of Inbound’s list of the top 115 MarTech companies. We assigned a percentile and a corresponding letter grade to the average number of shares. This way, we could see how well our content was performing in comparison to the other content out there. For example, if your posts gets enough shares to earn you a B grade, that means your content is performing better than 75 percent of other content.
Here’s the benchmark for total shares:
We also benchmarked shares for each social media platform:
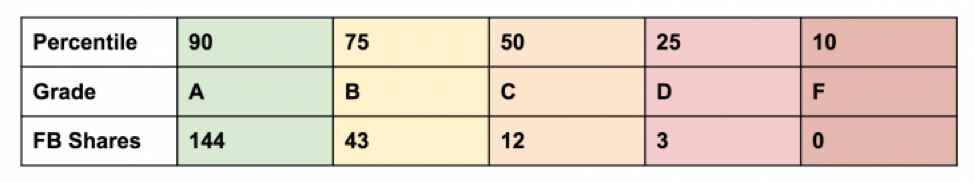
Facebook Benchmark
Here is the benchmark for Facebook shares per single blog post. As you can see, in order for your content to perform better on Facebook than 90% of other content, you need to get at least 144 shares.
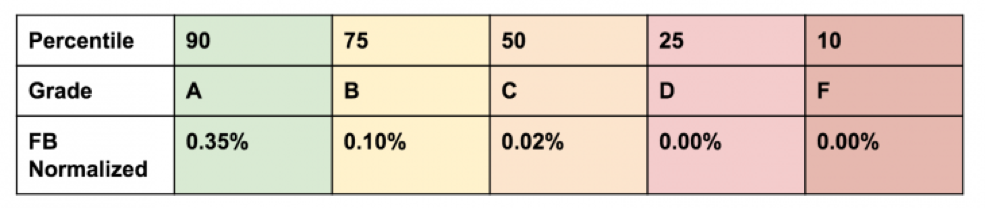
Now, below is the benchmark with normalized shares. What we found was that shares on Facebook for a given audience were actually quite low.
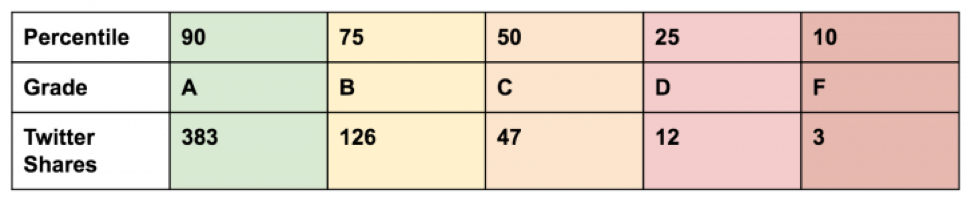
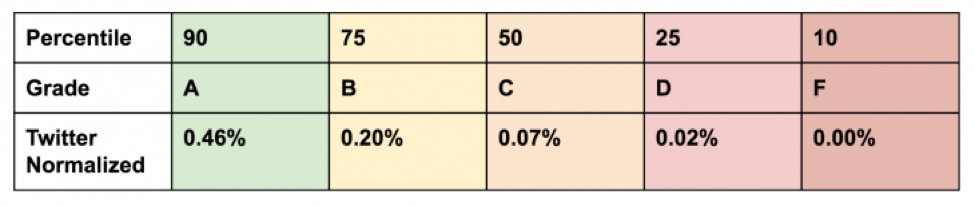
Twitter Benchmark
This benchmark is for Twitter shares per single blog post. As you can see, there are generally about triple the shares on Twitter than on Facebook.
And here are the normalized shares for Twitter.
Monthly Total Shares
While it’s useful to identify places for improvement on a platform by platform basis, it’s also important to not lose sight of the bigger picture. That’s why we also benchmarked the average total monthly shares for the top 115 MarTech companies. If you know what total share count you should be targeting month over month, you can then look at ways to achieve that in your content strategy.
This could mean doing more outreach for your content, targeting a specific social media platform, publishing more content in a month’s time, or any combination of factors.
Again, you can normalize these total monthly share counts to get a realistic snapshot of your blog’s performance. Just divide the total number of shares by the total number of followers. Look for correlations between your content’s performance on individual sites and the total monthly performance.
Set Realistic Goals
The purpose of this article is not to encourage you to be comfortable with your blog performance as it is–it’s to give you an actionable way to scale your content. Not only should you look for ways to gain new followers, but you should also look for ways to better engage your existing audience.
Being active and engaging on social media is something that a lot of companies struggle to do effectively. That’s why it’s so important to understand how engaged your audience is and where that engagement is happening. I hope this article has been helpful in pointing you in the right direction. Feel free to leave any questions in the comments.
If you’re interested in finding out more about audience engagement, have a read of Getapp’s case study.
INFOGRAPHIC

This post was by Sara McGuire of Venngage Infographics
Categories
Content MarketingCategories
Content MarketingThe Monthly Buzz⚡
Subscribe to BuzzSumo's monthly newsletter to:
Stay up-to-date with the best of the best in content marketing 📝
Get data-informed content, tips and tidbits insights first 👩🏻💻
Read top shared content by top marketing geeks 🤓
Try
Enter any topic, term or url to search to see BuzzSumo in action. It’s free!
100% free. No credit card required.