Published July 5th 2016
Why Video Should Be Used In Content Strategies: Facebook Data Insights
Facebook announced on Wednesday last week that it planned to make a series of changes to its news feed algorithm so that it will more favorably promote content posted by friends and family rather than publishers. The company said that content posted by publishers will show up less prominently in news feeds, resulting in ‘significantly less traffic’ to these publishers. This will be a concern for publishers and content marketers.
We decided to have a look at the Facebook share data and trends over the last year. This will establish a baseline to review future numbers and trends following the upcoming changes. We reviewed 25m Facebook posts published by the top 10,000 publishers over the last year. Note: all charts below are based on this data.
What we found might surprise you and make you rethink your strategy.
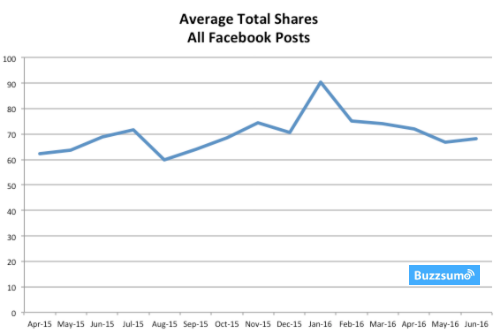
Average Total Shares
Over the last year there has been small increase in the average shares of all posts published by the top 10,000 publishers.
What this data masks is a significant variation between post types as we can see below.
Links and Referral Traffic
The importance of referral traffic from Facebook to publishers can be seen in research from Parse.ly, a digital publishing analytics company, which shows more than 40 percent of referral traffic to news sites comes from Facebook.
Facebook has said it expects the changes announced on June 29 will cause a drop in Facebook reach and referral traffic for publishers.
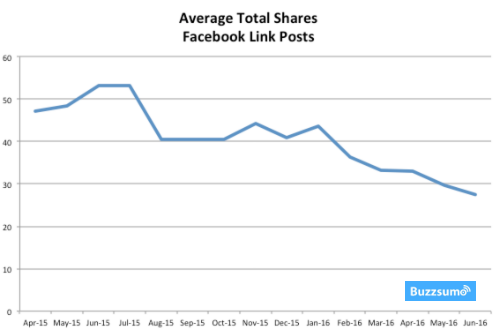
From our data we can see there has already been a fall in the average shares of Facebook posts that contain links over the last year. There is a very clear trend of lower shares per post over time.
Video Content
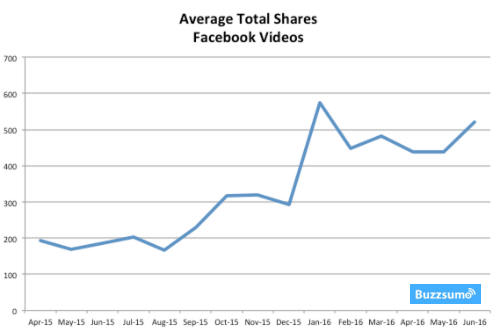
The one format that is driving significantly higher shares on Facebook is videos. The chart below shows very significant growth in the average shares per video post. Average shares have more than doubled since last August. This may be due to Facebook’s focus on video, the auto-playing of videos and similar factors but whatever the reason the data is quite clear.
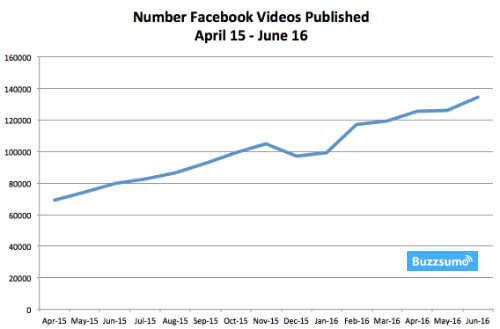
Publishers already understand how well videos work on Facebook. If we look at the number of videos published on Facebook by the top 10,000 publishers over the last year, we can see that they have more than doubled their Facebook video output.
We shared the results with some leading commentators and experts for their view on these trends. Ian Cleary, CEO of Razor Social believes we are still in the early days of video growth.
“We’re in early stages of the growth of video content on the Facebook platform and it’s obvious that Facebook is giving video a boost through it’s algorithm. Now is the time to take advantage and leverage it to it’s potential”
Julia Bramble, a Facebook expert and adviser, highlights the benefits of video:
Video is a massively important form of content because of the immediacy of connection it provides. Video can be used to inspire, educate, challenge or entertain. However, it’s popularity doesn’t mean that you can ignore best practice – offering the best content match for your audience is just as important for video as it is for any other form of content.
So who is getting it right when it comes to video? The top Facebook video publishers by average interactions per video in May and June 2016 were as follows:
| Facebook Page | Average Interactions per Video |
| Buzzfeed Tasty |
476,013 |
| Vlechten met daan |
183,358 |
| Buzzfeed Nifty |
164,142 |
| Real Madrid |
126,613 |
| Fallon Tonight |
117,883 |
| Game of Thrones |
100,732 |
| Tip Hero |
100,510 |
| FC Barcelona |
96,459 |
| LAD Bible |
66,303 |
| Q Political |
54,052 |
| Brightside |
46,273 |
| Shared Food |
37,788 |
| Sun Gazing |
37,278 |
| Collective Evolution |
36,663 |
| Genial Guru |
33,430 |
| Hefty |
33,012 |
Find out more about the types of video that get attention and engagement.
There are also some quirks of Facebook video as Julia Bramble points out namely that up to 85% of videos are viewed with the volume off.
On the positive side Facebook makes it very easy to monitor your video performance providing with metrics such as the total number of video views, number of views to 10 seconds or more, and the average percentage of the video viewed.
Looking for inspiration on creating Facebook videos? Read our guide on how to create thumb-stopping Facebook videos that engage with users.
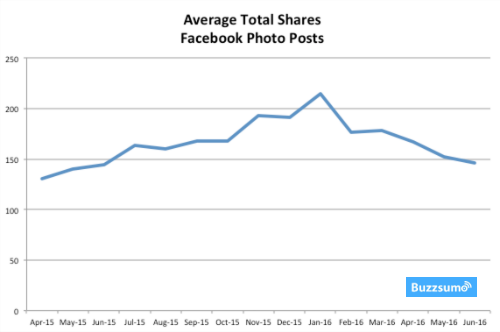
Photo Posts
Over the last year we saw a growth in shares of photo posts through to January but this has since fallen back over the last 5 months. Over the year as a whole we have not seen much change though we need to keep the recent downward trend under review.
Conclusion: Video, Video and More Video
If you are looking to increase your Facebook reach and shares, or at least to maintain your shares after the forthcoming changes, the data indicates you need to be looking at video content. Top publishers are already increasing their Facebook video output. What is your Facebook video strategy?
Categories
Content MarketingCategories
Content MarketingThe Monthly Buzz⚡
Subscribe to BuzzSumo's monthly newsletter to:
Stay up-to-date with the best of the best in content marketing 📝
Get data-informed content, tips and tidbits insights first 👩🏻💻
Read top shared content by top marketing geeks 🤓
Try
Enter any topic, term or url to search to see BuzzSumo in action. It’s free!
100% free. No credit card required.
