We built machine learning models and used them to analyze 400,000 articles in order to see what they would tell us about making engaging content.
There’s an art and a science to writing great content, as well as a strong element of luck. For content marketers everywhere looking for that magic formula to apply to their uninspired content and suddenly receive 100 million shares – it doesn’t exist.
Nobody wants to be responsible for a resurgence in clickbait (“10 weird tricks you won’t believe about conveyancing – number 3 will shock you”). However, we’ve tried to take a novel approach to understanding what tweaks you might be able to make to your content to help make the most of its potential.
We trained machine learning models with BuzzSumo data to find out what boosts your content engagement on social media and help you get those extra likes and shares. Here’s just some of those key insights:
- Facebook provides the most content engagement
- On Facebook, create likeable content and you can expect more substantive content engagement to follow
- If Twitter is your main platform, carefully consider amplification strategies
- Tweaking content can turn a dial, not a switch
Skip to the methodology here.
Choose your platform wisely
Success on Facebook does not equal success on Twitter
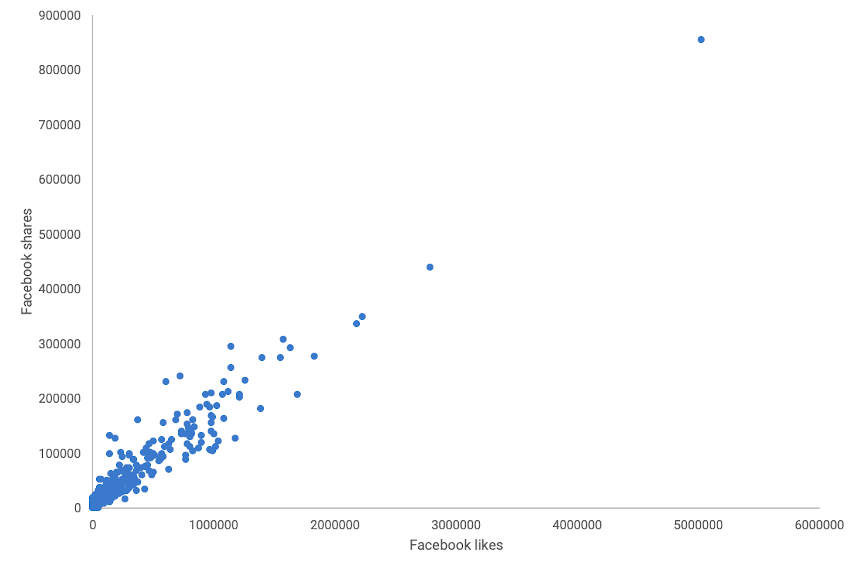
Content which generates very strong engagement on one social networking site isn’t necessarily going to see much engagement elsewhere.
Below plots the number of Facebook shares versus the number of Twitter shares for the content in our dataset. As you can see, a lot of content performs very well on one platform, but very poorly on the other:
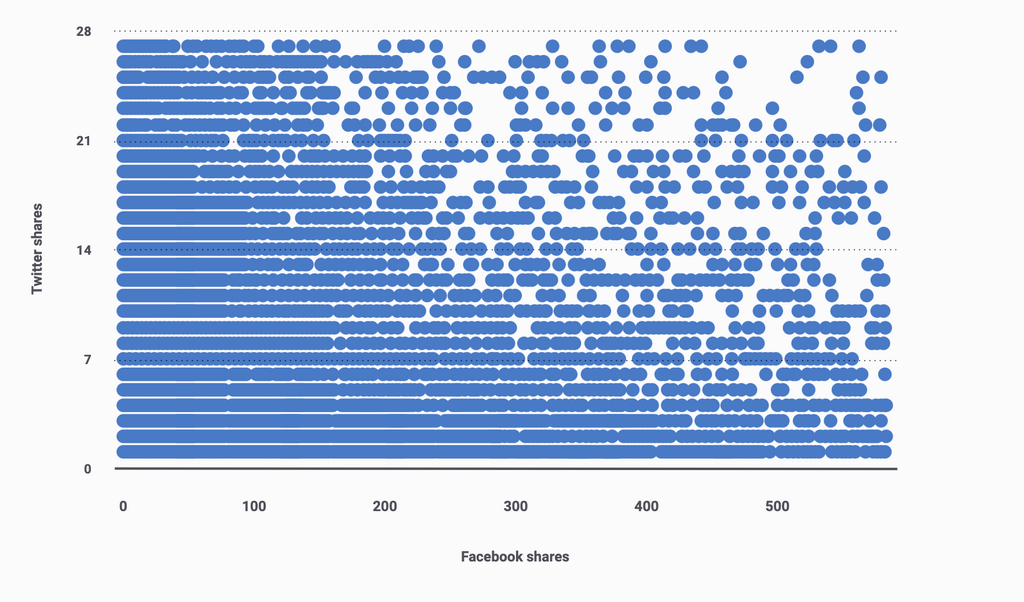
There are different ways of interpreting this.
It could be that Facebook users and Twitter users are interested in very different things. Another factor may be randomness in content engagement patterns, or factors often outside the control of a content creator, such as if an influencer happens to chance upon your content and amplify it. This might be comforting to those who’ve written highly engaging content one day, which then only gets 2 measly likes the next.
Although we can see general patterns, realistically, chance probably plays an important role too. This underlines the risk of drawing bad conclusions by reading too much into the performance of a small group of posts.
Tools like BuzzSumo let you escape your social media bubble and access enough data to look into the broader trends, which will allow you to better assess and understand the themes your audience engages with.
Examples of content with a significant mismatch between Twitter and Facebook performance
| Title | Facebook Shares | Twitter Shares |
|---|---|---|
| Andrew Boyajian: International Payments Expert Focused On Secure Technology" | 0 | 34 |
| Rethinking credential theft | 0 | 194 |
| A beautiful new look for an old desk" | 169 | 0 |
| How to Get Around for Less with Rider Kenny Uong" | 186 | 1 |
Which platform is best for you?
We’ve seen that successful content on one platform isn’t always successful on the other, and our modeling suggests Facebook and Twitter users do engage with different types of content (which we’ll explore soon).
One way you can understand this, is by keeping records of the content you release, and how much engagement it gets on different platforms. When you have the volume, you can look for patterns in what Facebook users are interested in, versus what Twitter users are interested in, etc. This could help you understand what your audience on different platforms are interested in, saving you time and money on successful content.
Alternatively, you can use BuzzSumo for trend spotting to understand what consumers engage with, and how users of different platforms engage differently. Simply type in the url of your own site into the Content Analyzer to compare content engagement over time and find out which articles are driving success across different networks.
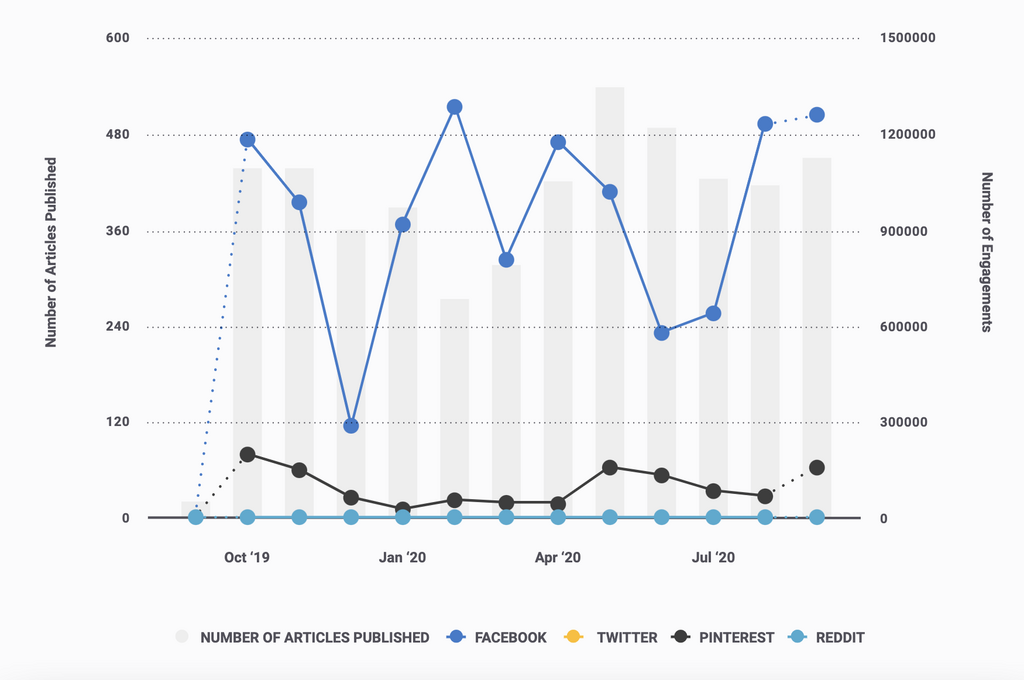
As an example, if we look across tasteofhome.com’s content engagement, it’s clear that most comes from Facebook, with Pinterest being the second most popular network.
Digging a little further into their output and it is clear that, in some cases, engaging content on Facebook doesn’t have the same effect on Pinterest. Here are two of the most popular articles in the past year: both have similar levels of content engagement on Facebook but, whilst one got 6.5k shares on Pinterest, the other only got 14.

One is a recipe post, with mouth watering photos and handy tips (6.4k Pinterest shares). The other is a news article probably based on a press release (14 Pinterest shares). Breaking down your content into themes and then cross referencing with the engagement will help you recognize what content works best where.
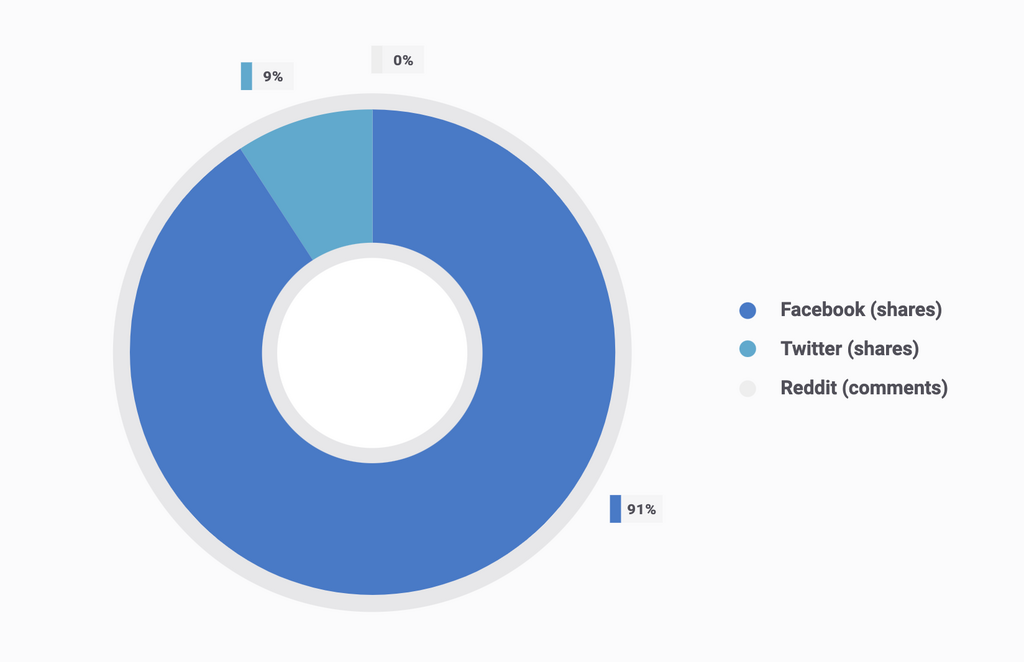
Facebook provides the most content engagement
It’s difficult to make direct comparisons between platforms (is a Facebook share really equivalent to a retweet?), but any way we split it, Facebook comes out on top. Given the platform’s dominance, we have focused on Facebook analysis, with some comparisons to Twitter. Links outside of these platforms are not shown, as they made up a very small percentage of measurable engagement.
On Facebook, create likeable content for substantial engagement
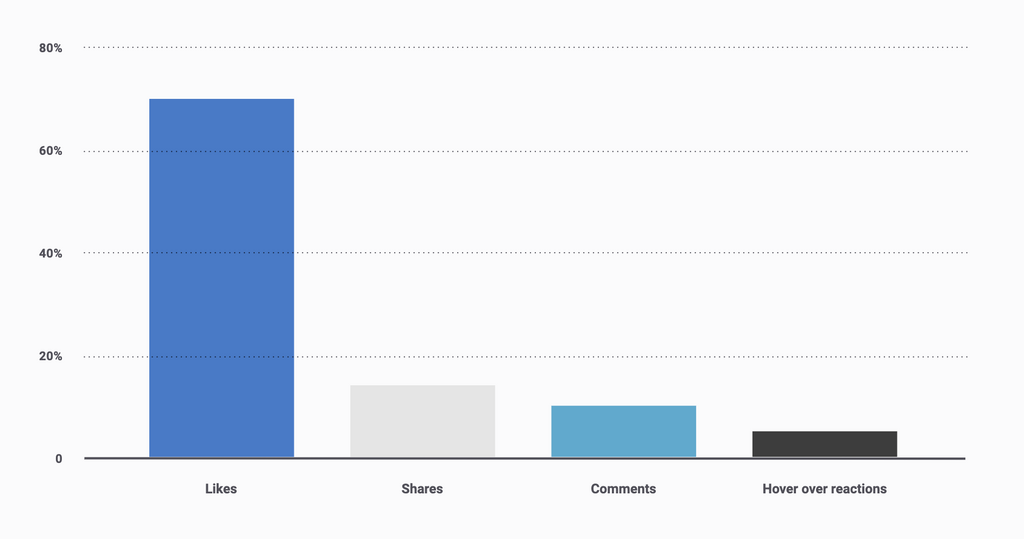
On Facebook, likes made up the bulk of content engagements (70%).
Likes were highly correlated with shares and comments, suggesting that if you can write content that can stimulate people to click the ‘like’ button, you’ll also be putting yourself in the best position to get more substantive engagement, too. You don’t need to seek out specific responses, like asking people what they think – those will come naturally.

If Twitter is your main platform, carefully consider amplification strategies
Twitter does have the advantage of being far more open than Facebook, in the sense that you can better understand what people are talking about, and more easily find influencers who can help amplify your content.
Using these strategies can help you overcome some of the challenges of working with a platform that has a smaller user base
Tweaking content can turn a dial, not a switch
This following section is based on the behavior of machine learning models, which predicted whether or not a piece of content would be in the top 20% of most highly engaged posts (Compared to the expected number of engagements based on the prominence of that site).
We provided these models with information about the words and phrases in the title, as well as some metadata about the content (for example, the number of words and the readability score). These became our “Features”; things that the model can identify within content, and that a person creating content is able to change.
Across all models, we didn’t see any features making more of a 6% contribution to the probability of creating high content engagement, which reinforces that there’s no magic formula to uncover when creating high performing content. Some tricks may help you, but the actual content itself matters, and we have every reason to believe there’s still a strong element of chance.
How to write engaging content
To understand what businesses and individuals can do to create more engaging content, we recreated the model with only blogs included. Here, our dataset is mostly made up of three types of blog: business, hobbyist and commentary on social and current affairs.
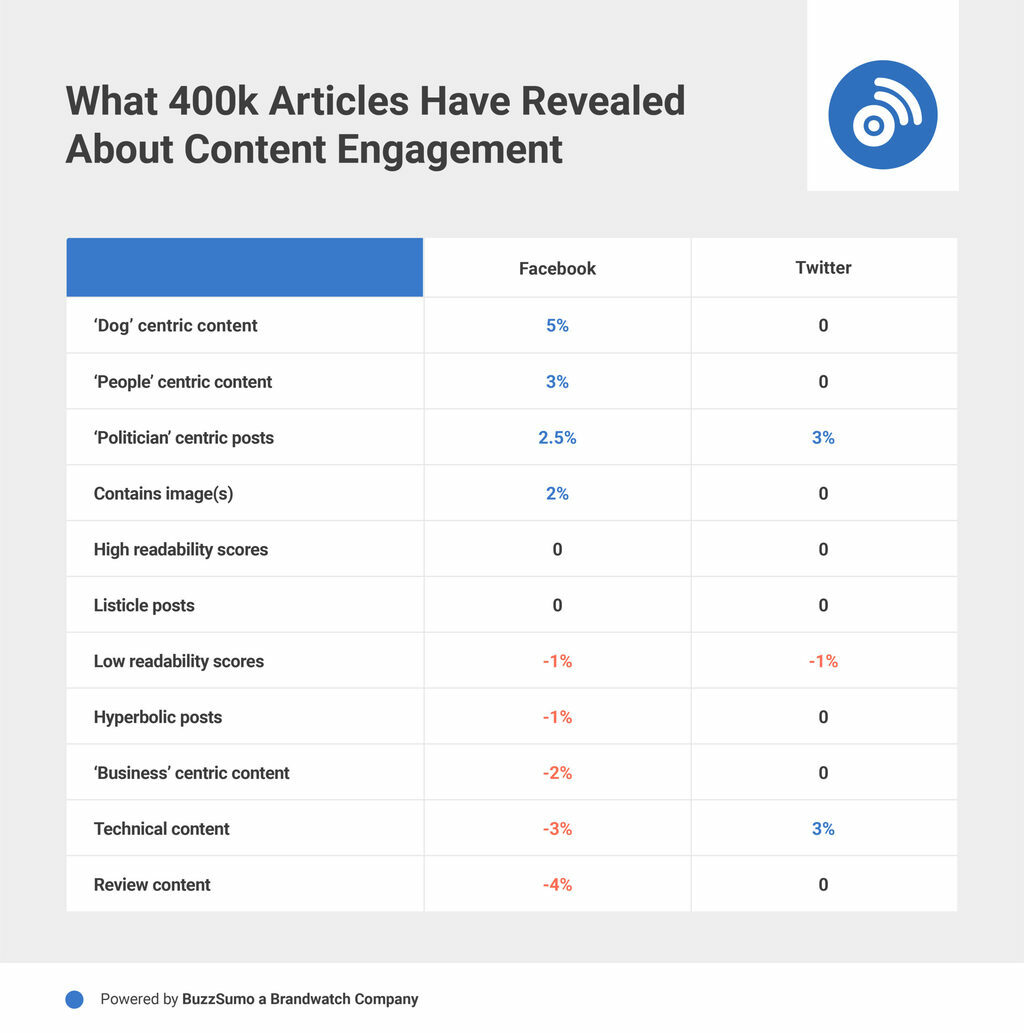
See below for our top-level findings on the most engaging ‘Content types’ across Twitter and Facebook, and read on for more insight into each category.
Simpler language doesn’t necessarily appeal to more people
Having a word length less than 1000 words reduces the likelihood of high engagement on Facebook by 1%, while having 1000 to 2000 words increases the high engagement likelihood by 1%. Similar results were seen for Twitter.
Additionally, another feature in our model was the Automated Readability Index, a readability measure which takes into account the lengths of words and sentences, with posts containing longer words and sentences receiving higher scores.
We found that the content with readability scores in the lowest 10% had about a 1% lower chance of being predicted as high engagement on Facebook. Similar results were seen on Twitter, with higher scores being associated with greater engagement.
However, there seems to be more to lose with a very low readability, than there is to gain with a very high readability, with little discernible difference between the performance of average and high readability scores. This suggests you don’t necessarily need to oversimplify, but there’s probably not much to gain by breaking out the thesaurus for words like “abnegation” (renouncing or rejecting) or “antediluvian” (before the Biblical flood).
If you want to look at the readability score of your own content, you can use this online test.
"It's very interesting to see that the simplest language isn't always the most engaging, even though that's the advice that's been passed around for ages. I think this speaks to one of the most important marketing principles: Speak to your audience. All best practices come second to what your particular readers are looking for, and if you provide the content they want, you're much more likely to engage them."
- Amanda Milligan, Marketing Director, Frac.tl
"Low readability score" example posts
| Title | Facebook Shares | Twitter Shares |
|---|---|---|
| Al Pacino Dumped Because He’s Old And Cheap | 11 | 10 |
| Who painted Ella? | 24 | 1 |
| Dunstans slam NSW MP over dud response | 119 | 0 |
"High readability score" example posts
| Title | Facebook Shares | Twitter Shares |
|---|---|---|
| Old age comes at a bad time" | 1.1K | 0 |
| Should You Ever Allow a Tenant to Break a Lease Without Penalty?" | 37 | 227 |
| The Secret Montreal Experiments They Don't Want You To Know About?" | 1.2K | 2 |
| When to change ISO underwater | 65 | 0 |
Longer content, a little more engagement
If we rank all posts by the number of words they contain, those in the bottom 10% can be expected to have about a 1% smaller chance of having high Facebook engagement. There’s a familiar pattern of diminishing returns, however, with very little to gain by having extremely long content.
Images help drive engagement
Posts with images are around 2% more likely to have high Facebook engagement, but didn’t make a discernible difference on Twitter.
Content with many images
| Title | Facebook Shares | Twitter Shares |
|---|---|---|
| Fun Facts about Slinky Dog Dash in Toy Story Land | 630 | 0 |
| How to Set a Preferred Language on Wordpress Websites | 35 | 32 |
Politics in titles can generate strong engagement
It was difficult to find examples of businesses discussing politics or individual politicians – perhaps that’s due to a cautiousness on their part. However, political content, from comment-oriented blogs to more analysis-based posts, do seem to outperform expectations. This suggests that brands could benefit from exploring how they might be able to make content relevant to politicians.
Interestingly, we saw greater effects on Facebook for individual political figures (Trump and Bernie are shown below, with similar effects for Obama and Buttigeg), than for more conceptual political terms, such as poll, and policy. Party-related terms, such as “Democrat” and “Democrats” were linked to higher engagement.
“Trump”
Change in high engagement likelihood (Facebook): +3%
Change in high engagement likelihood (Twitter): +5%
"Trump" example posts
| Title | Facebook Shares | Twitter Shares |
|---|---|---|
| Job Growth Is Less During Trump Administration Compared To Obama Administration | 41 | 17 |
| Donald Trump is a D" | 113 | 33 |
| Pure Blasphemy! Host Sees “Christ” Emanating From Trump" | 1.6k | 84 |
“Bernie”
Change in high engagement likelihood (Facebook): +2%
Change in high engagement likelihood (Twitter): +1%
"Bernie" example posts
| Title | Facebook Shares | Twitter Shares |
|---|---|---|
| Freaking Bernie | 137 | 1 |
| So the Russians wanted Bernie elected President all along" | 408 | 1 |
Hyperbole doesn’t seem to help
“Love” was one of the more common words in titles, giving the model a good opportunity to learn if this term would help content get more engagement, yet it didn’t appear as one of our highly explanatory features.
Including the word “love” seems to have negligible impact, with other hyperbolic, such as “great” and “amazing” also not appearing to boost engagement. We actually found evidence that “best” was linked with lower buzz.
Having said that, posts including these terms did appear to elicit around double the number of “love” reactions on Facebook (14 on average for posts without these terms, compared to 33 for posts that did include these terms).
“Best”
Change in high engagement likelihood (Facebook): -1%
"Best" example posts
| Title | Facebook Shares |
|---|---|
| Hotels With The Best Views In The World" | 2 |
| The 10 Best Home Insurance Companies for 2020" | 7 |
| Best Ways to Organize Your Digital Information: The Only Guide You Need" | 0 |
We also didn’t find any measurable effect from listicle-related terms, such as “10”, “things” or “ways”, despite these being very common.
"Listicle" example posts
| Title | Facebook Shares |
|---|---|
| 10 Top Hospitality Trends in today’s connected world" | 24 |
| 7 amazing ways to get blog post ideas" | 8 |
| Top 10 Exam Revision Tips" | 278 |
Facebook users respond to individualized content
We saw evidence of a variety of people-oriented terms, such as “man”, “woman” and “female” and “mom”, being linked with higher-than-expected buzz on Facebook. The most significant of these appears to be the term “people”:
“People”
Change in high engagement likelihood (Facebook): +3%
Change in high engagement likelihood (Twitter): No measurable change
"People centered" example posts
| Title | Facebook Shares | Twitter Shares |
|---|---|---|
| People Don’t Outgrow the Effects of Childhood Trauma Just Because They Become Adults" | 84k | 149 |
| Projects funded by Germany make a difference" | 170 | 19 |
| Barriers Ahead for People Living with HIV on Social Security Disability Insurance?" | 471 | 5 |
However, these effects appear to be much smaller on Twitter, suggesting that, as a platform, Facebook may be a little more interested in people-oriented content.
In contrast to this, there was also evidence that terms around organizations may be linked to lower engagement.
That suggests business-oriented content could sometimes benefit from a more human-angle. Here we focus on the term “business”, but a similar effect was seen for “Marketing”.
“Business”
Change in high engagement likelihood (Facebook): -2%
Change in high engagement likelihood (Twitter): No measurable change
"Business centered" example posts
| Title | Facebook Shares | Twitter Shares |
|---|---|---|
| A social enterprise - a business for good" | 84 | 0 |
| Retiree versus Business Person: Travel Choices" | 53 | 1 |
| Growing Your Business with Insights from Google Search Console" | 20 | 1 |
| Why & How to set Boundaries in Business" | 17 | 0 |
Again, these business terms appear to be strongly connected with low engagement on Facebook, but we didn’t find strong evidence this is the case with Twitter content. Together, this may suggest that if you do want to take a business angle, your promotional money may be better spent on Twitter.
Cats aren’t the secret to winning the internet
Similar to findings around individual-oriented content potentially pushing the dial upwards on Facebook more than Twitter, terms around animals weren’t highly predictive of success on Twitter.
For cat lovers, we unfortunately didn’t see as much of an impact, but that could partly be due to fewer posts containing the words “cat” or “cats”, thereby giving the model fewer opportunities to learn.
“Dog”, “Dogs”
Change in high engagement likelihood (Facebook): +5%
Change in high engagement likelihood (Twitter): No measurable change
"Dog centered" example posts
| Title | Facebook Shares | Twitter Shares |
|---|---|---|
| Why Dogs Eat Grass—a Myth Debunked" | 13.6k | 0 |
| Feeding & treating 1000 stray dogs a week: the Marina Möbius story" | 6.6k | 0 |
| Charcuterie Boards for Dogs Are Called Barkuterie And We Love It" | 850 | 2 |
Retrospective content may not be as engaging as current topics
The term “Book” was associated with a 3% decline in the likelihood of performing well on Facebook; a chunk of this content was book reviews. However, it should often be possible to reframe this content and play off the interest that Facebook users show in the human angle.
“Review”
Change in high engagement likelihood (Facebook): -4%
Change in high engagement likelihood (Twitter): No measurable change
"Review" example posts
| Title | Facebook Shares | Twitter Shares |
|---|---|---|
| Search marketing: A decade in review" | 13 | 6 |
| openSUSE Tumbleweed – Review of the week 2020/08" | 0 | 1 |
| A Review of “Little Women” by Jake Maddia" | 33 | 1 |
| 4 Interviews with World-Class Athletes - The Running Podcast Review: Episode 6" | 55 | 1 |
Technical content struggles on Facebook, but may succeed on Twitter
“Data”
Change in high engagement likelihood (Facebook): -3%
Change in high engagement likelihood (Twitter): +3%
A similar pattern was seen for “Cloud”, which was linked to low buzz on Facebook (-1%), but high buzz on Twitter (+5%).
"Technical content" example posts
| Title | Facebook Shares | Twitter Shares |
|---|---|---|
| Rising From The Ashes: Vantage Pro2 Reports Data From Australian Wildfire" | 14 | 3 |
| Useful data sets for Call for Code" | 1 | 23 |
Conclusions
- Facebook remains king of generating content engagement. Twitter still has an important role to play, especially because the openness of the platform allows you to connect with influencers more easily. If you are able to create content that gets passive engagement, such as likes, you can expect to see more substantive engagement, too.
- Facebook and Twitter users show broad similarities in what they engage with most, although Twitter may be more receptive to overtly business-facing content, with Facebook more interested in the human angle
- Random chance seems to play a very important role in how much engagement individual posts receive. Don’t abandon a topic just because you’ve written about it once and didn’t get much interest – you might find a similar post in the future gets widely shared. Similarly, you can’t assume that a well performing post demonstrates consumers are going to engage with that topic again. Instead, try to look at broad trends in what people engage with, across many posts – you should find it easier to see real patterns that way
- Features turn a dial, not a switch – in our analysis, no feature increased the high performance likelihood by more than 6%. Of course, this figure is likely to vary by context, but it does suggest that you can’t expect to change one small thing about your content and expect it to perform very differently
- Diminishing returns – if you find it difficult to write very long and complex content, that’s okay – a little effort goes a long way
Method
Random forest models were created to predict whether a given piece of content would over- or under- perform based on the prominence of the website. Given the weak relationship between engagement on different platforms, a model is aimed at predicting only engagement for a single platform – i.e. the model predicting Facebook engagement is different to the model predicting Twitter engagement. In general, they tended to be around 60% accurate.
Compared to other models used in the field of social media data analysis, the accuracy of these models is low, however, this is to be expected, given that the model has very limited information – for example, it doesn’t know how many subscribers the author of a YouTube video has, or information about what people are talking about in the real world. Additionally, these models are not optimized to be highly accurate – rather, the ideal model is highly interpretable, as the interpretation is the real goal.
The LIME Python library was used for some of the model interpretation, and you can read more about it here.
Table Sources:
Examples of content with a significant mismatch between Twitter and Facebook performance:
- Andrew Boyajian: International Payments Expert Focused On Secure Technology"
- Rethinking credential theft
- A beautiful new look for an old desk
- How to Get Around for Less with Rider Kenny Uong
"Low readability score" example posts
"High readability score" example posts
- Old age comes at a bad time"
- Should You Ever Allow a Tenant to Break a Lease Without Penalty?"
- The Secret Montreal Experiments They Don't Want You To Know About?"
- When to change ISO underwater
Content with many images
- Fun Facts about Slinky Dog Dash in Toy Story Land
- How to Set a Preferred Language on Wordpress Websites
"Trump" Example Posts
- Job Growth Is Less During Trump Administration Compared To Obama Administration
- Donald Trump is a D"
- Pure Blasphemy! Host Sees “Christ” Emanating From Trump"
"Bernie" example posts
"Best" example posts
- Hotels With The Best Views In The World"
- The 10 Best Home Insurance Companies for 2020"
- Best Ways to Organize Your Digital Information: The Only Guide You Need"
"Listicle" example posts
- 10 Top Hospitality Trends in today’s connected world"
- 7 amazing ways to get blog post ideas"
- Top 10 Exam Revision Tips"
"People centered" example posts
- People Don’t Outgrow the Effects of Childhood Trauma Just Because They Become Adults"
- Projects funded by Germany make a difference"
- Barriers Ahead for People Living with HIV on Social Security Disability Insurance?"
"Business centered" example posts
- A social enterprise - a business for good"
- Retiree versus Business Person: Travel Choices"
- Growing Your Business with Insights from Google Search Console"
- Why & How to set Boundaries in Business"
"Dog centered" example posts
- Why Dogs Eat Grass—a Myth Debunked"
- Feeding & treating 1000 stray dogs a week: the Marina Möbius story"
- Charcuterie Boards for Dogs Are Called Barkuterie And We Love It"
"Review" example posts
- Search marketing: A decade in review"
- openSUSE Tumbleweed – Review of the week 2020/08"
- A Review of “Little Women” by Jake Maddia"
- 4 Interviews with World-Class Athletes - The Running Podcast Review: Episode 6"
"Technical content" example posts
The Monthly Buzz⚡
Subscribe to BuzzSumo's monthly newsletter to:
Stay up-to-date with the best of the best in content marketing 📝
Get data-informed content, tips and tidbits insights first 👩🏻💻
Read top shared content by top marketing geeks 🤓
Try
Enter any topic, term or url to search to see BuzzSumo in action. It’s free!
100% free. No credit card required.