Updated September 20th 2022
Introducing Facebook Page Analyzer And Facebook Pages
Want to improve the performance of Facebook campaigns, benchmark against competitors, and investigate industry trends on Facebook?
You’ve come to the right place.
We’re pumped to be bringing you two new BuzzSumo tools that can help you transform your Facebook social strategy:
- Facebook Page Analyzer
- Facebook Pages
How does the Facebook Page Analyzer & Facebook Pages make your life easier?
Facebook is the world’s largest social media platform, so it’s safe to say Facebook data is pretty important.
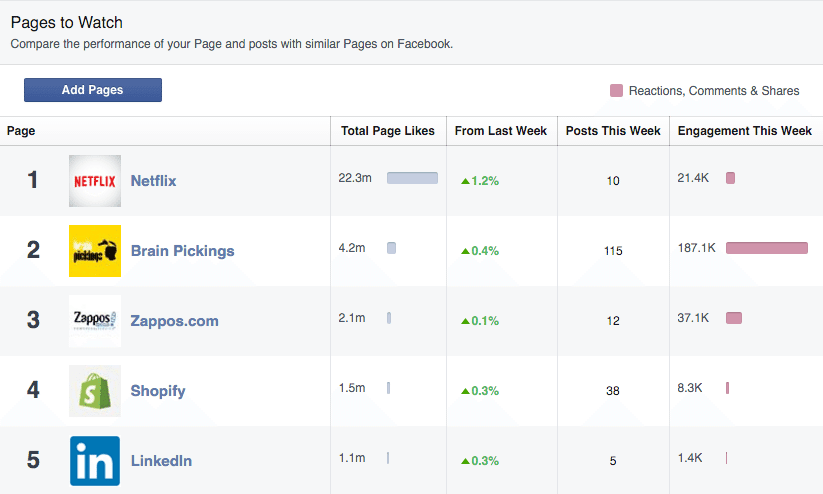
Facebook’s own “Page Insights” tool does allow you to compare your performance and posts with similar pages on Facebook via the “Pages to Watch” feature.
But this information is limited: you can only view the previous week’s worth of data, can’t see clear breakdowns in engagement, and can’t easily export information.
What’s more, Facebook can be difficult to navigate, so identifying the key pages making an impact in your industry can be time consuming.
To make matters worse, searches and feeds can also be influenced by the Facebook algorithm, meaning it’s harder for you to determine pages that are having a big impact on your audience.
Enter the BuzzSumo Facebook Page Analyzer & Facebook Pages
These tools are available to all our Suite and Enterprise plan users, and with them you can...
These tools enable:
1. Easy competitor comparison
Compare both individual posts and top-level engagement of up to 9 pages at any one time, and deep-dive into competitor insight.
2. Advanced, quick, and actionable insights
Power your Facebook performance with scaled Facebook insights, in seconds.
3. Speedy discovery of the top performing Facebook pages
Facebook Pages makes identification of thousands of pages at a time as simple as typing in a keyword. You can break out of your algorithm bubble and discover influential pages based on your most important keywords.
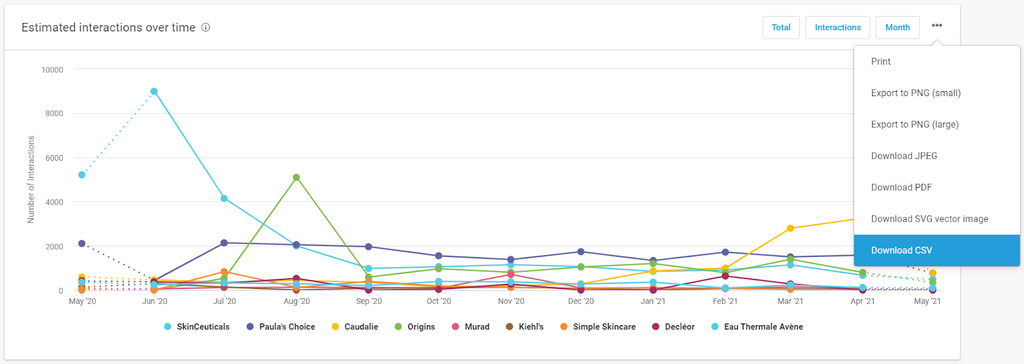
4. Historical trend analysis to track page performance over time
Having a more comprehensive data overview over a longer period of time allows you to find actionable insights, and see broader historical trends.
5. Easy reporting
BuzzSumo’s Facebook Page Analyzer allows you to quickly compile exportable reports with CSV and graph downloads.
Not only does this insight help you spot the competitors making waves in your industry, it enables you to unpick competitor game plans, and upcycle their best Facebook strategies.
Here’s 7 easy ways to use BuzzSumo’s new Facebook tools
1. Discover competitors & influencers that weren’t even on your radar
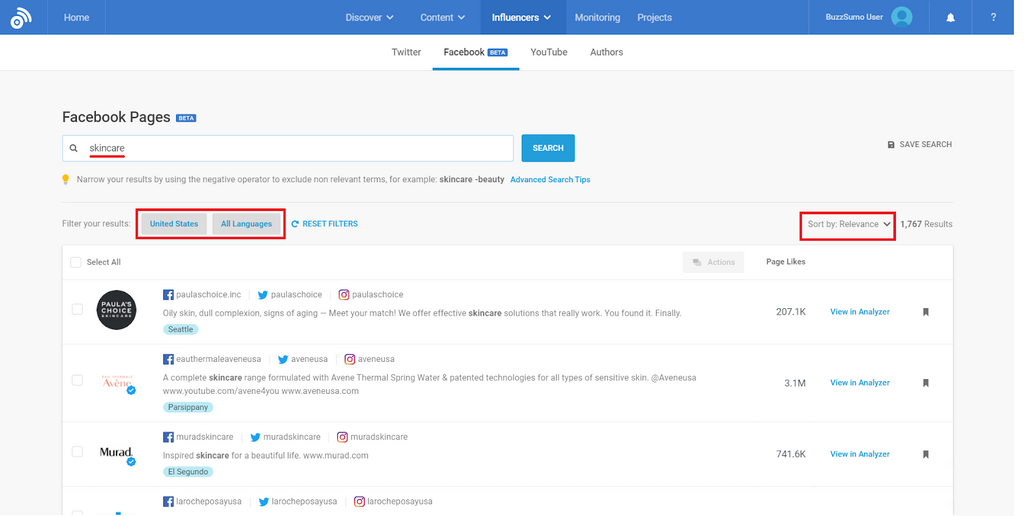
The new Facebook Pages tool allows you to use a simple keyword search to discover relevant and influential Facebook pages.
In seconds you can uncover thousands of top performing competitors and influencers. No more guesswork involved.
Your keyword search can be niche, industry, or even influencer-focused, to return relevant pages themed around that topic.
Facebook Pages are sorted by "Relevance" default, but you can also find pages based on likes, and follower counts.
Relevancy is determined by evaluating a number of different components, including:
- Facebook page username
- Facebook page ‘about’ and ‘description’ sections
- Twitter lists associated with any corresponding Twitter profile
Use this tool to determine your most closely aligned competitors, or thought leaders.
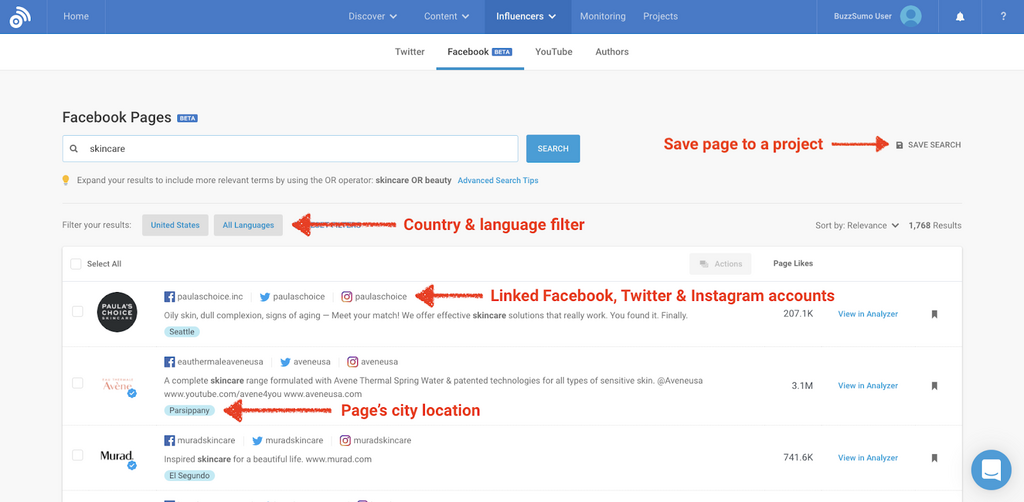
And add filters to narrow-down results, and make that decision even easier:
- Filter pages by country
- Filter pages by language
- Explore actual Facebook page content, by clicking the link
- Explore linked Instagram accounts
- Explore linked Twitter accounts
- Discover the page’s (city) location
- Or save pages to a project for future analysis
Once you’ve discovered your competitors or influencers, you can take them over to the Facebook Page Analyzer...
2. Benchmark Facebook performance against your top competitors
Head to the “Influencers” tab in BuzzSumo, to find Facebook Pages.
Then simply:
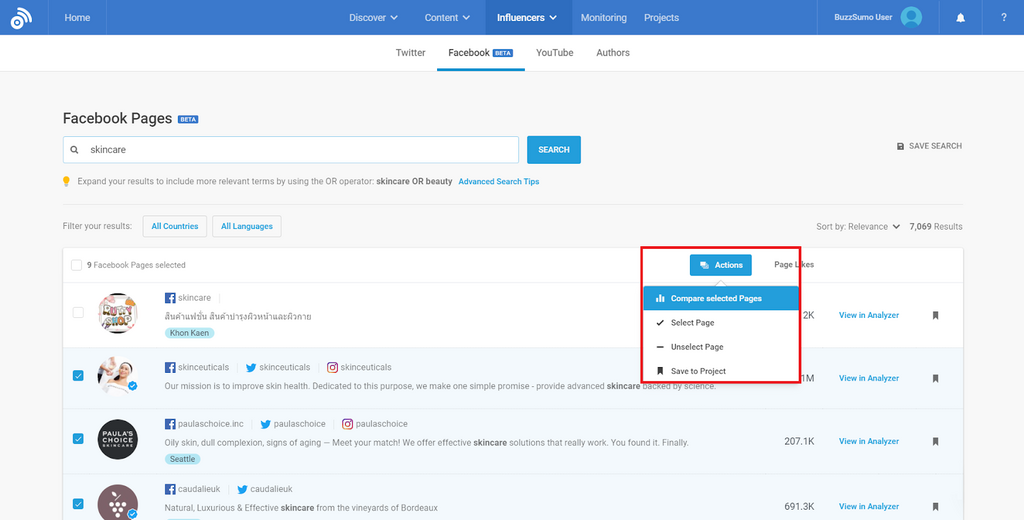
- Search your keyword
- Select up to nine competitors
- Click the “Actions” dropdown
- Choose “Compare selected pages”
This will take you straight over to the Facebook Page Analyzer where you can start benchmarking your competitors.
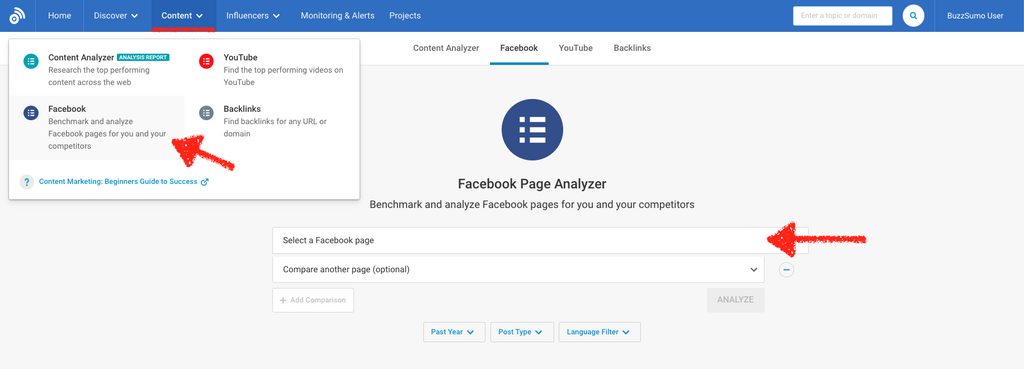
Alternatively, you can go straight to the Facebook Page Analyzer in the “Content” section of BuzzSumo, and type in your known competitors.
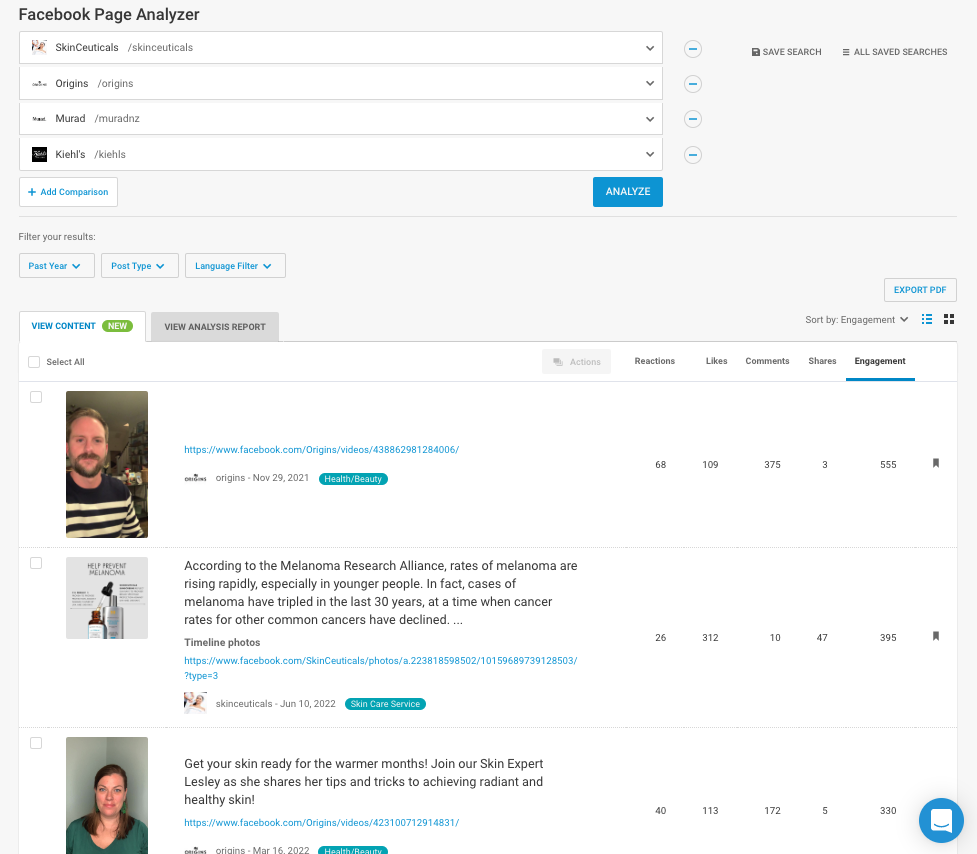
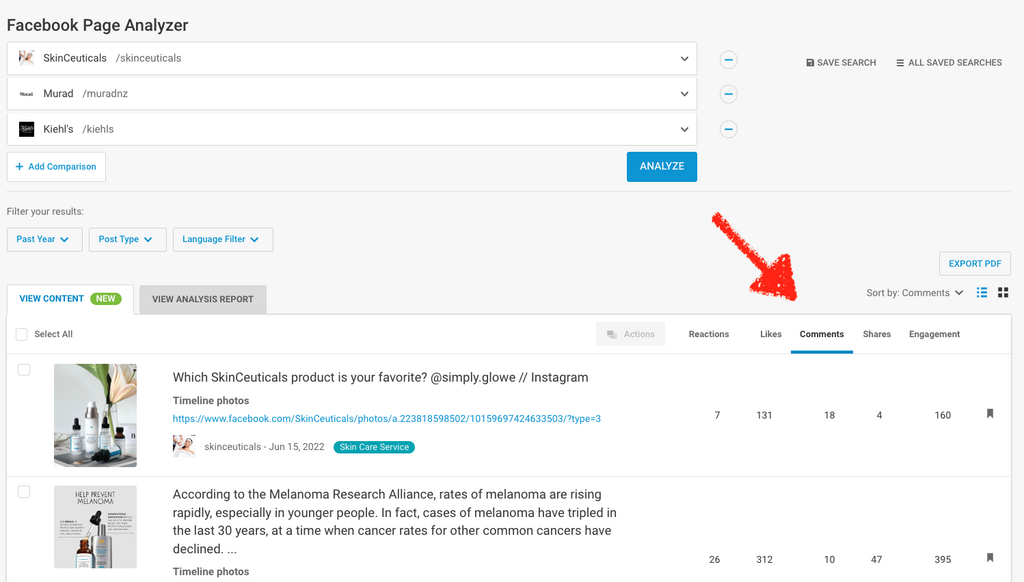
Analyze the performance of competitor posts
From the very beginning, get an understanding of your competitors' best posts.
See the top content formats, and get a full breakdown of engagement.
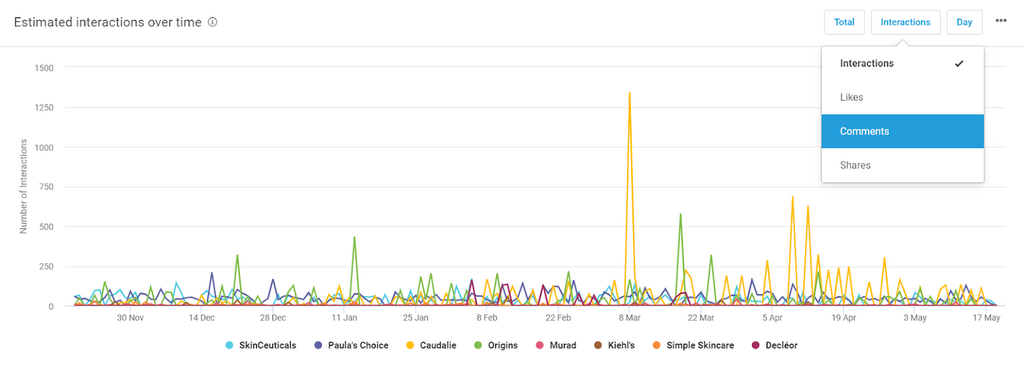
Want to see what's driving the most discussion? Easy. Just sort by "Comments".
Then once you're done with the finer analysis, start looking at overall performance by hitting "View Analysis Report"
This will give you a full report of competitor performance, including:
- Overall # of posts, engagements, and average engagements
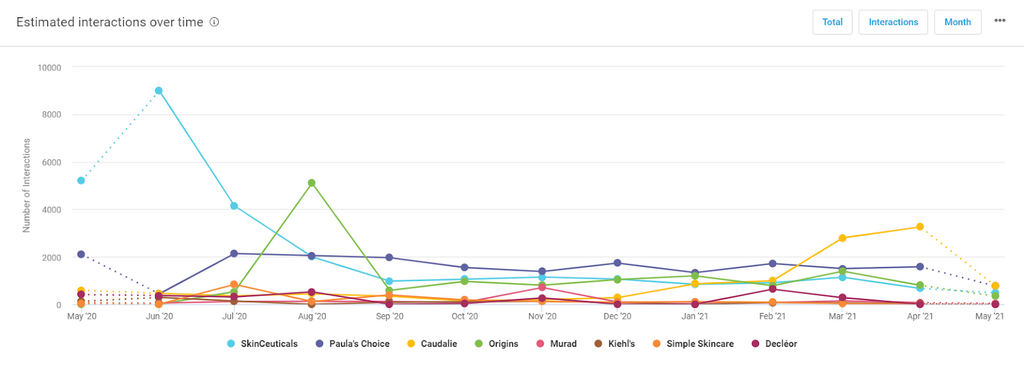
- Posts and engagements trended over time
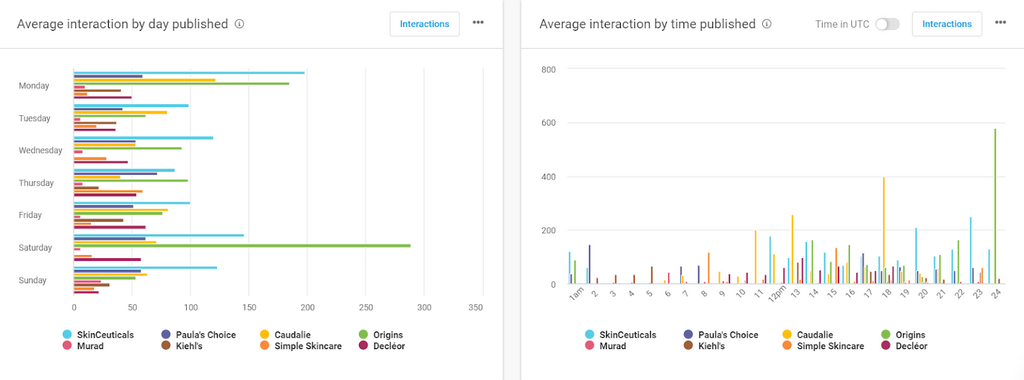
- Average engagement by day published
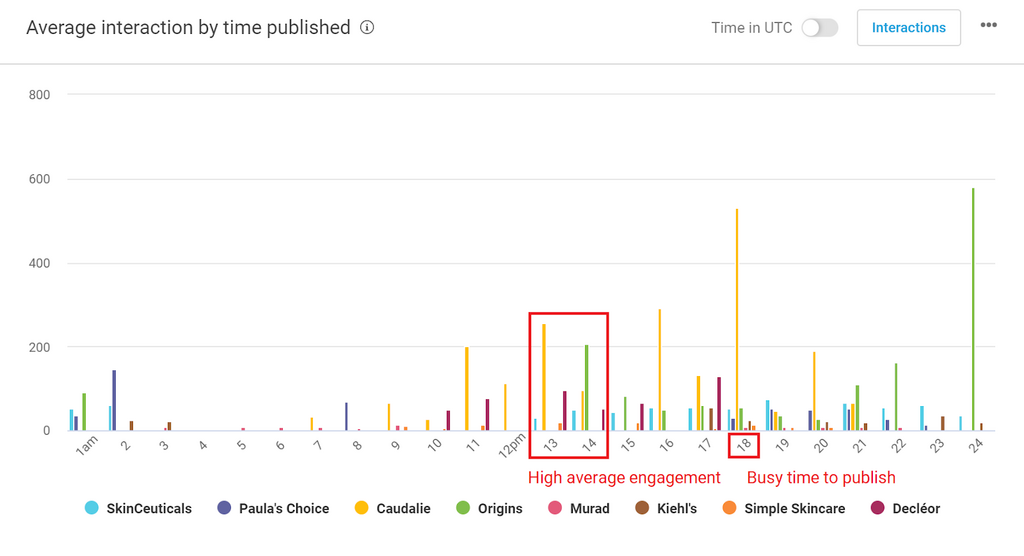
- Average engagement by time published
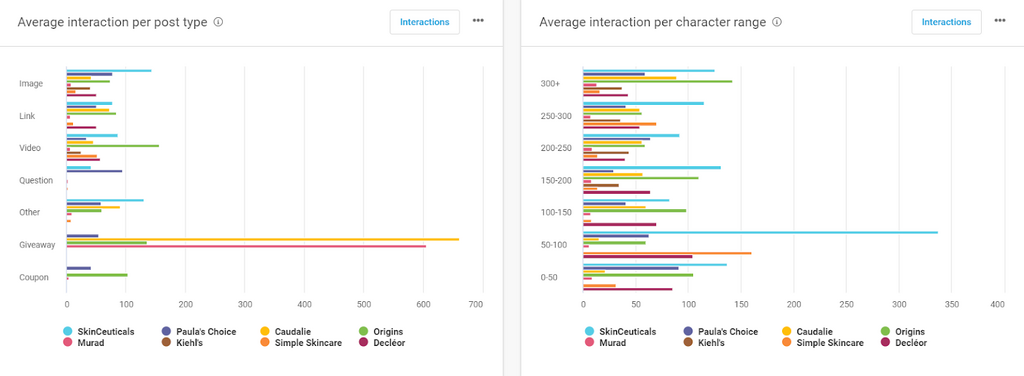
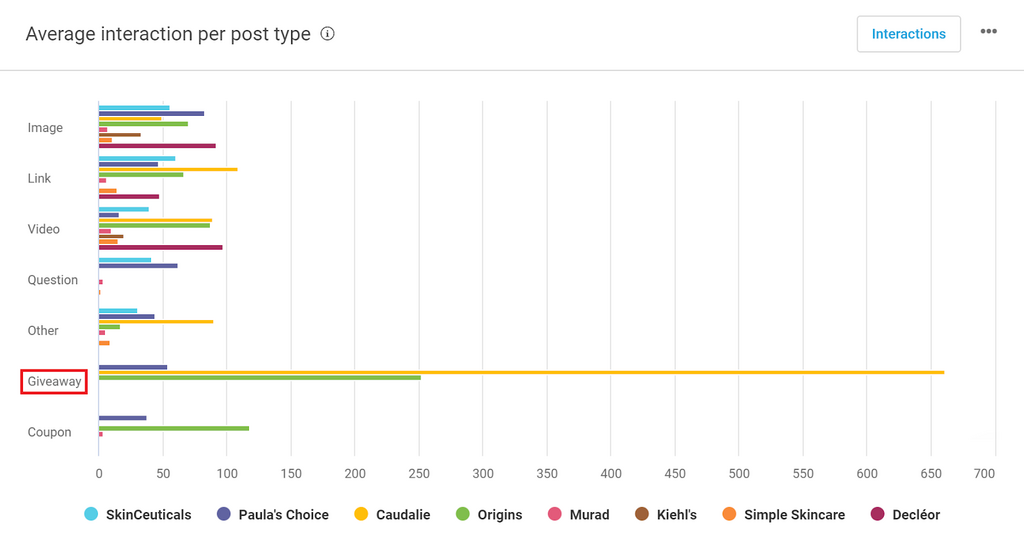
- Average engagement per post type
- Average engagement per character range
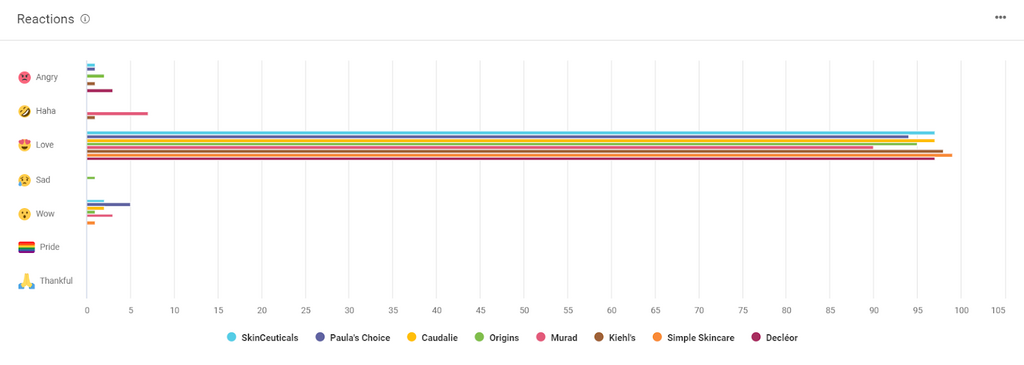
- Facebook reactions
Benchmark engagement
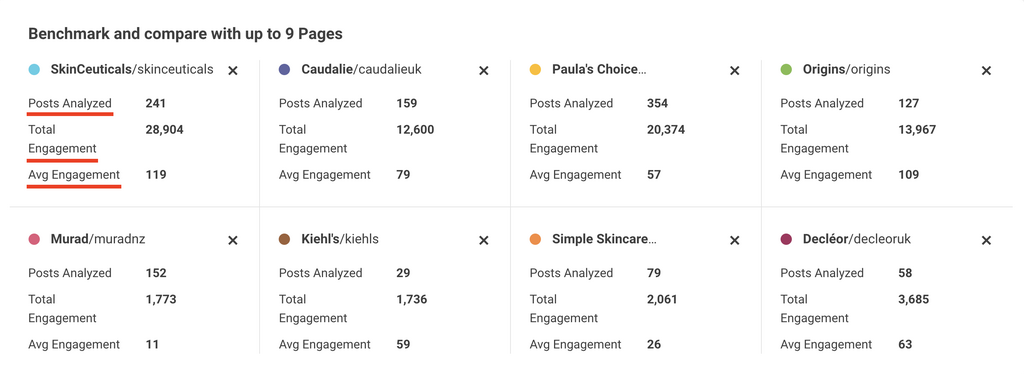
Know which of your competitors are most active on Facebook (Posts Analyzed) and which get the most engagement (Total Engagement or Avg Engagement), via the report overview.
In this example, the top player is SkinCeuticals, with the highest number of:
- Total engagements
- Average engagements
Over the chosen date range ie. the last year.
3. Get new ideas and dive into competitor content
Single out your competitors’ top posts and take note
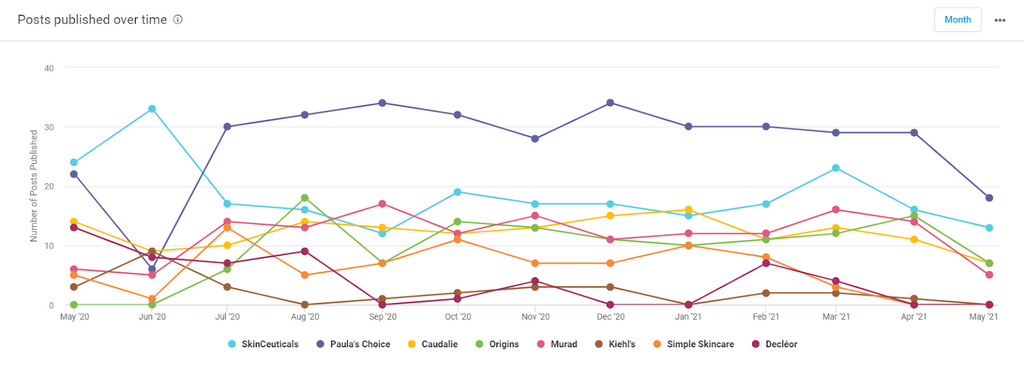
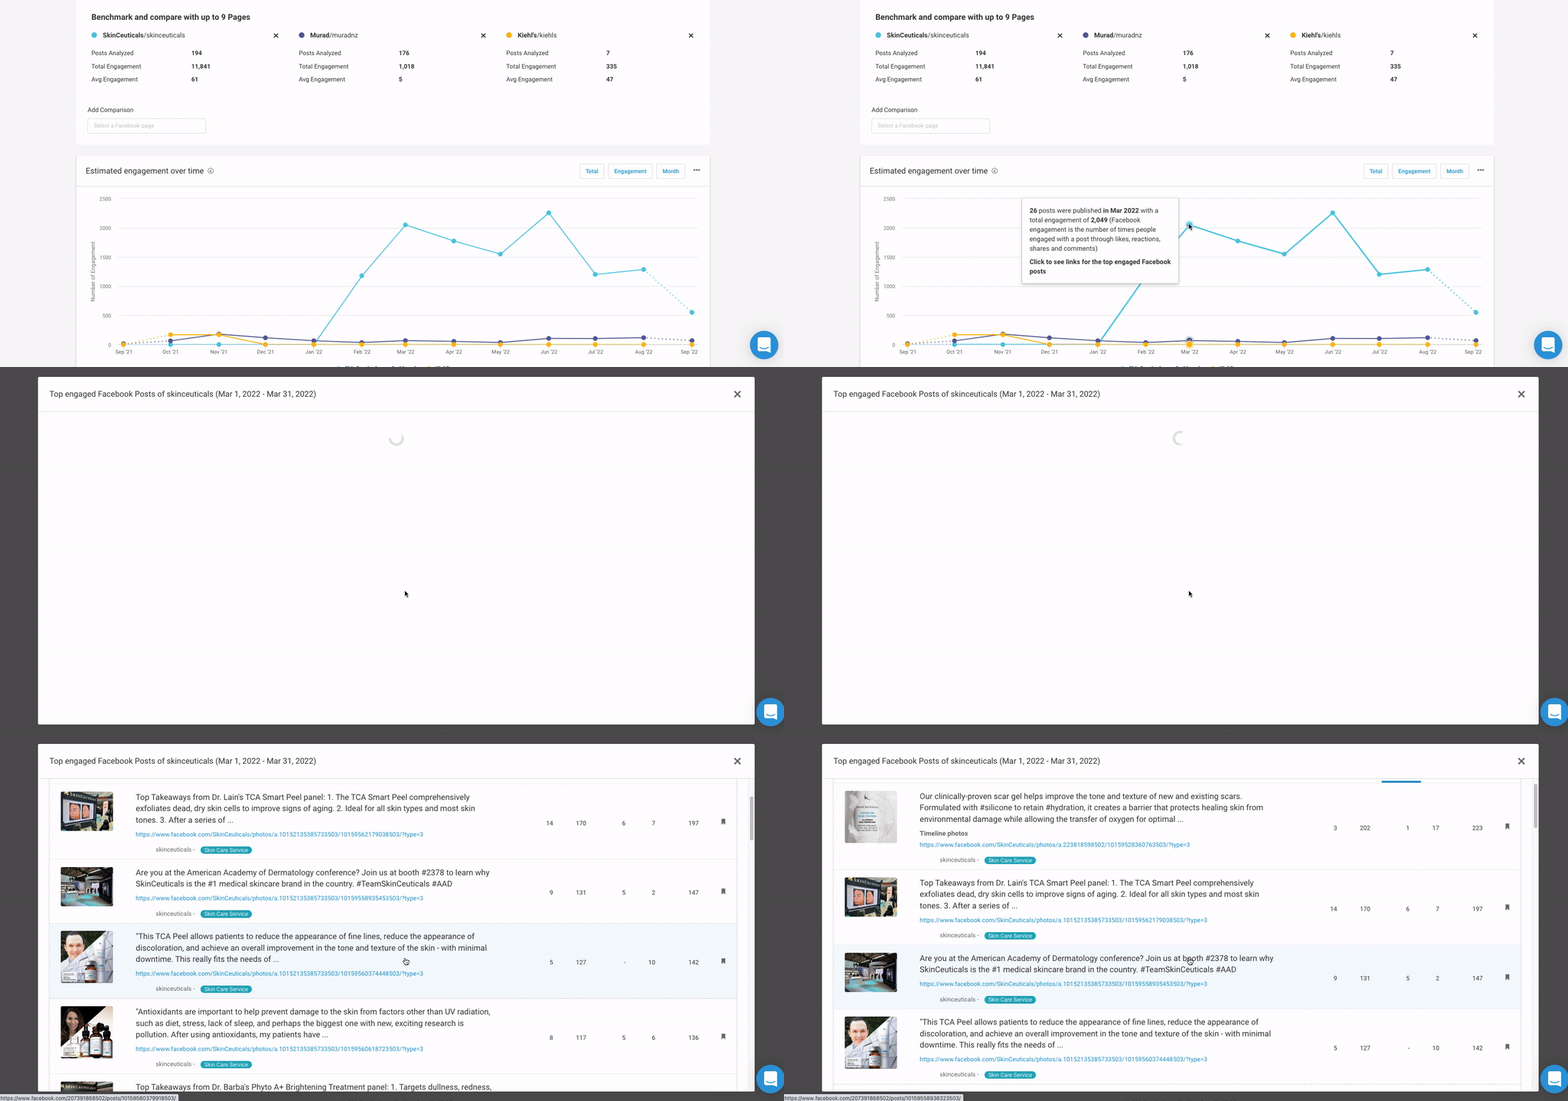
Looking at trends in engagements over time, you can hone in periods of high engagement, and investigate further.
For example, we can see that SkinCeuticals experiences a sharp increase in average engagement in March.
We can find out more about the posts behind that peak simply by clicking into it...
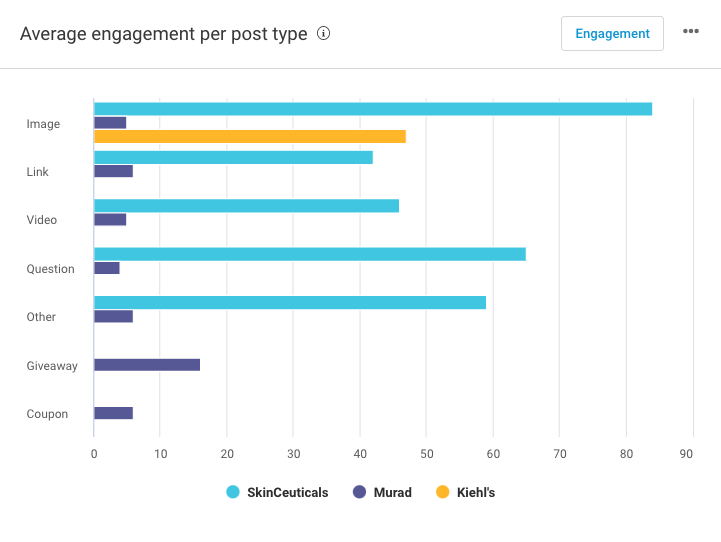
And to find out which post types are working hardest for our competitors, we can head down to the "Average engagement by post type" chart in the report...
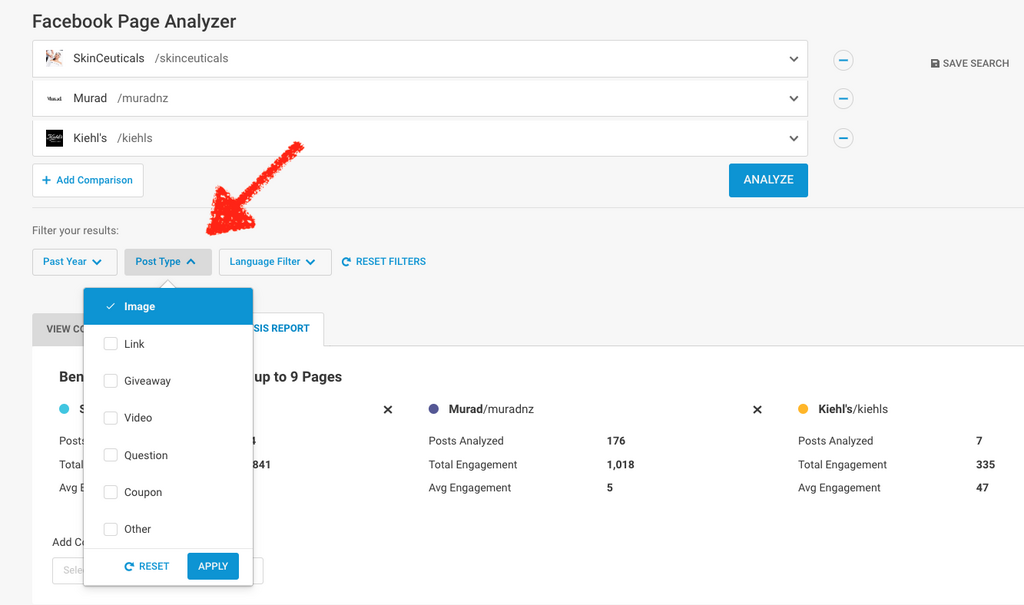
Once we have that figured out, we can get even more granular with our analysis, by filtering the entire report to hone in only the most engaging post type.
In this case, that's "Images".
4. Report on the performance of campaigns
Factor Facebook performance into your reporting to impress your managers and / or clients, with a detailed analysis of personal, competitor, or client campaigns.
Here's how...
5. Inform your social scheduling strategy
Don’t follow the herd – unless you’re sure they’re getting it right.
Many social media tools suggest times to post based on competitor activity.
BuzzSumo’s Facebook Page Analyzer looks not just at when your competitors publish, but also how the audience respond, to give you a better indication of when your audience is actually most engaged.
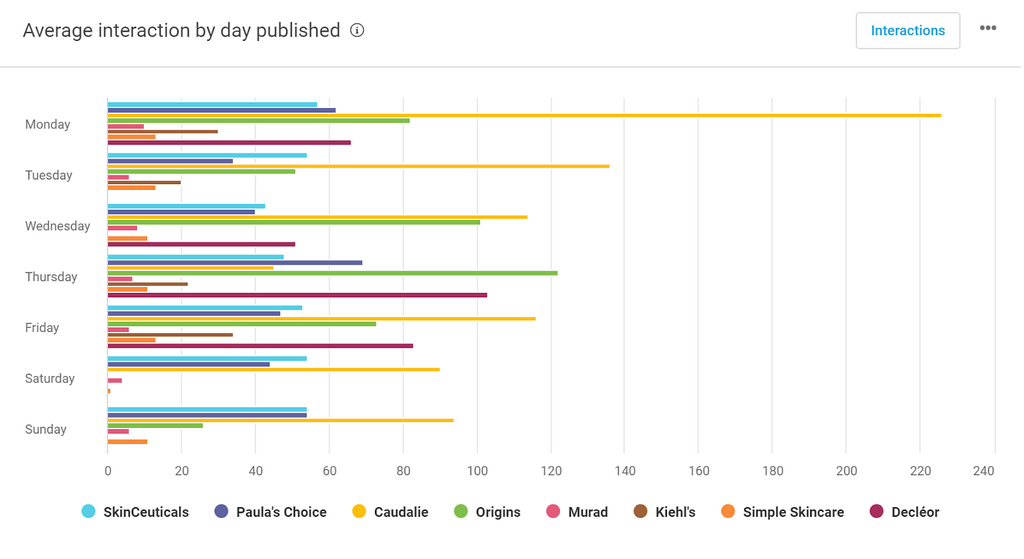
In the skincare report below, audiences of skincare brands seem to be most engaged on a Monday.
There doesn’t appear to be any direct correlation between engagement and time published in the skincare niche, which indicates that the post type and content is more important here.
But, if you look closer, there are still some insights to be had. You can see, for example, that 18:00 is a busy time to post — with all but one competitor publishing at this time — whereas 13:00 - 14:00 has high average engagement, but fewer publishers present.
You can use this kind of insight to power your social media scheduling strategy.
6. Spot content gaps and opportunities
With the Facebook Page Analyzer, not only do you discover what your audience is looking for, you unearth what they're missing out on.
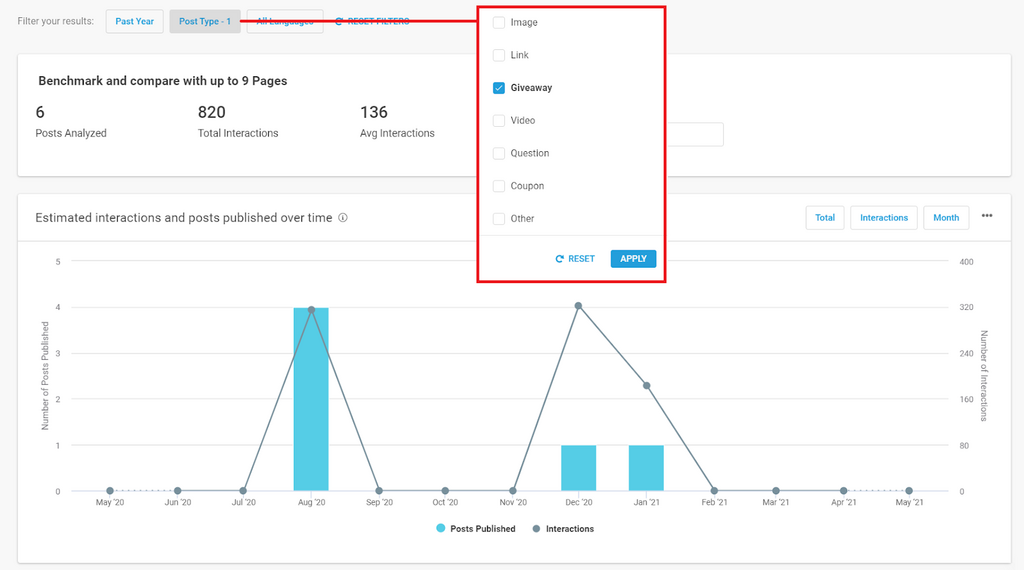
For example, looking at post types, you can spot content gaps where many of your competitors have yet to explore.
In the skincare industry, only three out of eight competitors have publicized giveaways on their Facebook pages, yet there is clear evidence to suggest that audiences love this kind of content.
Origins and Caudalie have seen between 250 - 650 engagements surrounding their giveaway content — approximately 120% above their average engagement count.
This is a clear content opportunity for other skincare brands to take advantage of on Facebook.
This method will help you find successful content ideas for Facebook campaigns, time and time again.
Work out the cost of your content efforts
You can also use the content post engagement data in this report to project the cost and ROI of your content efforts.
For example, let’s imagine you’ve decided to do a giveaway worth $100.
If you know from your competitor analysis that your giveaway is likely to receive 650 engagements, the cost of this content activity will be $0.15 per engagement (ie. 100 / 650 = 0.15).
So for as little as $0.15 per interaction, you could build some pretty impressive organic engagement.
Spot ROI opportunities
From there you can calculate an approximate ROI to justify your content decisions, by comparing organic Cost Per Engagement (CPE) against the cost of paid advertising.
According to AdEspresso, Cost Per Like (CPL) on Facebook’s advertising platform equated to $0.20 for the first three quarters of 2020.
If you subtract the $0.15 CPE of your giveaway from this paid $0.20 CPL, you’d achieve a minimum cost saving of $0.05 per engagement, or a grand total of $32.50 – if you’re aiming for 650 engagements overall.
We say minimum here because an organic giveaway campaign has greater potential to generate more than just likes.
If competitor performance is anything to go by, it can encourage shares and comments too, which are even better forms of engagement.
What’s more, the amount of feed based impressions that will be generated by this trio of engagements may even surpass what could be achieved for the same price via paid advertising.
So there you have it. A pretty easy way to calculate the ROI of your content decisions on Facebook, by comparing industry benchmark data with Facebook Page Analyzer data.
7. Analyze your own Facebook page performance
If you want to hone in on just your own performance, you can do that too
Simply type your Facebook page into the Facebook Page Analyzer, select it from the dropdown, and start analyzing.
The report features all of the same data, including:
- Number of post, engagements and average engagement
- Posts and engagements over time
- Average engagement by day published
- Average engagement by time published
- Average engagement per post type
- Average engagement per character range
- Facebook reactions
Analyze the success of your own campaigns with country, language, and post type filters, and reflect on the Facebook posts working hardest for you.
So, there you have it. Seven things you can do with BuzzSumo’s new Facebook tools, to ensure your social media strategy works harder than any other competitor!
As we mentioned earlier, our Facebook Page Analyzer and Facebook Pages tools are available on Suite and Enterprise plans.
Let us know how you’re using our Facebook tools by clicking on the feedback link in the BuzzSumo app, or reaching out to us via Intercom with your thoughts.
Start building your Facebook page strategy today with a free 30-day trial of BuzzSumo – no credit card required!
Categories
BuzzSumo ToolsThe Monthly Buzz⚡
Subscribe to BuzzSumo's monthly newsletter to:
Stay up-to-date with the best of the best in content marketing 📝
Get data-informed content, tips and tidbits insights first 👩🏻💻
Read top shared content by top marketing geeks 🤓
Try
Enter any topic, term or url to search to see BuzzSumo in action. It’s free!
100% free. No credit card required.

