Marketing trends come and go, so when a content type defies the trend, it’s important to take notice. Original research is doing just that. When Steve Rayson recently analyzed 100 million articles, he found that:
“Authoritative research and reference content are the two types of content that consistently get links and shares.” –Steve Rayson, BuzzSumo Director and Co-Founder
The takeaway: Publishing original research is a substantial opportunity for marketers right now.
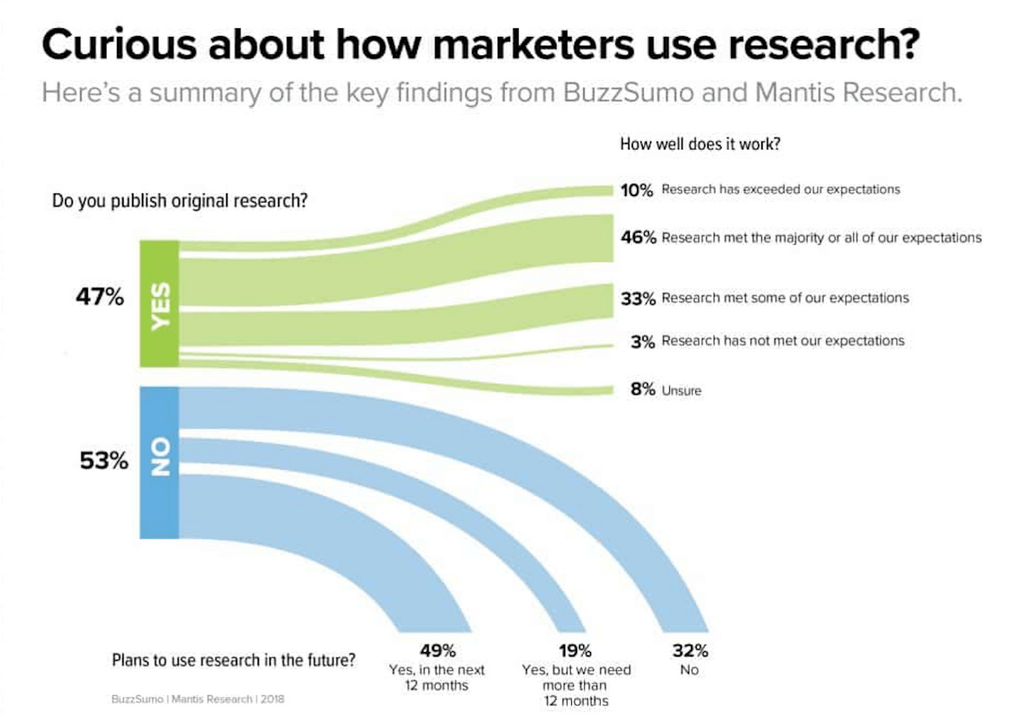
We recently partnered with BuzzSumo to study if and how marketers are using research, and we found that approximately half of them are. Another quarter (26%) have not conducted research but are considering doing so in the next 12 months.
The bad news? Those who are considering research think the biggest challenge will be understanding how to approach a project like this.
Publishing your own survey-based research is time-consuming, in part because it’s a multi-step process, but also because it is a new “muscle” for many marketers. But, you can do this if you educate yourself on the process.
During a recent webinar with BuzzSumo I shared key results from our joint research and answered the most common (and challenging) questions we tend to hear from survey respondents and those we talk with who are considering or conducting research.
If you prefer a more detailed version, you can view the webinar on this topic or check out the slides.
To check the performance of research content in your industry, use BuzzSumo’s
Common Questions About Original Research, Answered!
What is involved in an original research project?
All research projects go through 4 stages:
Strategy and planning: Similar to what you would do at the start of any new project, answer key questions such as why you are conducting research, what topic you want to cover, and how you’ll use the research.
Data science: When you conduct survey-based research, you need to decide which questions to ask (and how to ask them); program and test the survey; get responses and analyze the data.
(Note: This is where marketers have the most questions because this is where they have the least experience. Many of the questions below focus on data science.)
Research journalism: Next, you need to create the findings from your research. We consciously use the word journalism because it emphasizes how important it is to cover the story like a journalist. First and foremost, your research needs to tell a story.
Amplification: Your research is a jumping off point for a lot of promotion and related content. In fact, this is the area where those who are currently conducting research often have an opportunity to get even better results.
LEARN MORE: If you want to dig into the specific steps behind a research project, check out our guide that details the process.
How long does an original research project take?
Based on my conversations with those who conduct research in-house, a large-scale, survey-based research project takes 80 – 150 hours. Or, if you prefer to look at overall time frame, plan for at least 4 months.
Below is a general time frame you can follow. Of course, if you are new to research — or some of this will take place over a holiday or common vacation times — include additional time.
Research is time-consuming. How can we prove it is worth it?
Andy Crestodina — who cites that his annual research takes him 150 hours — believes that research is absolutely worth it. As he says:
“[Original research] may take 10x the effort to create, but you’ll likely see 100x the results of a typical article.”
Why does research work so well? Consider these four reasons.
1. YOU become the source of authority — and people link to you
As Margie Agin aptly said:
”Original research solidifies your position as a thought leader because it reveals problems that beg to be solved. It’s content no one else will have but everyone will want to share.”
That last part is so key: you are the source of data, and people will want to link to you. This is especially true if you publish your research on an annual basis and can report on trend spotting.
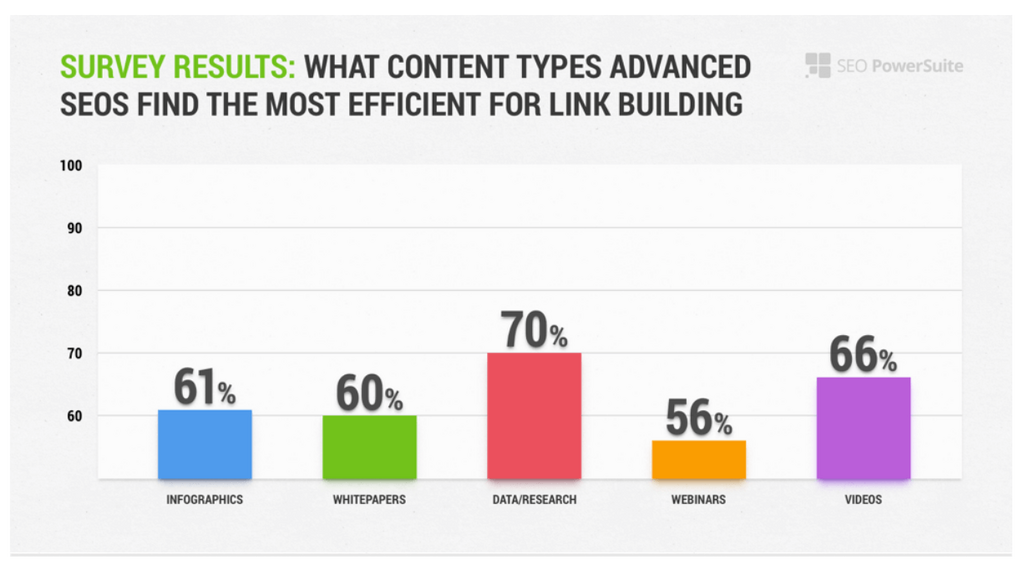
Data bears this out. SEO PowerSuite’s Link Building in 2017 survey of SEO professionals discovered that research and data is the most efficient type of content at getting links.
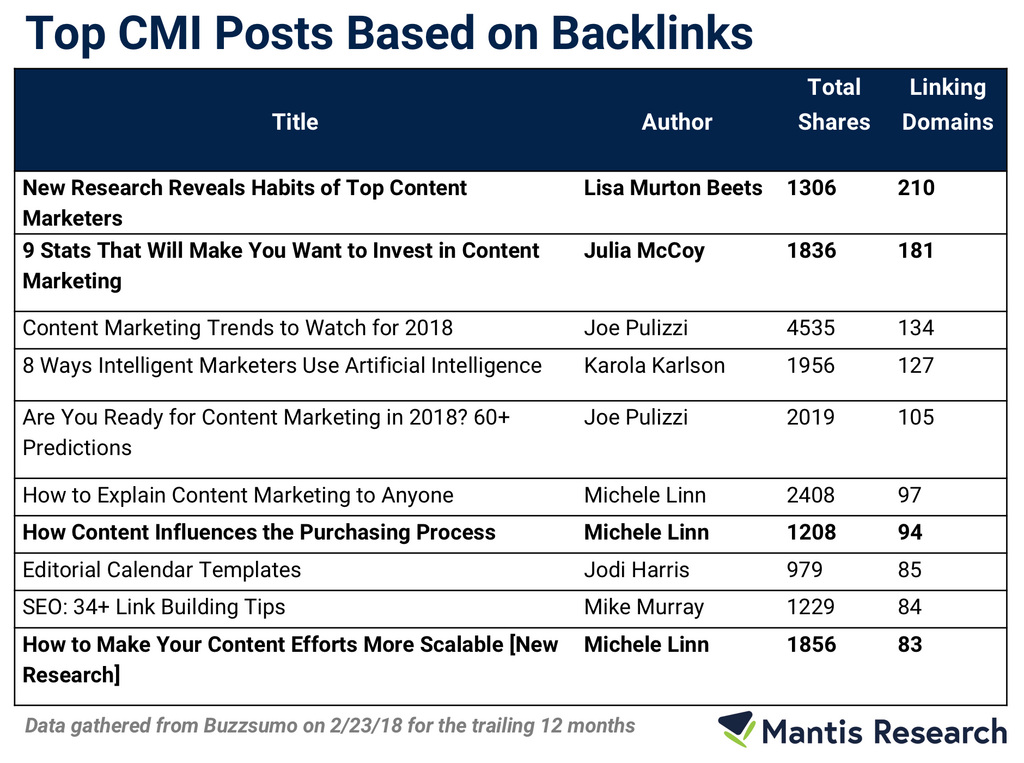
To see if this theory holds true, I used BuzzSumo to understand which posts on Content Marketing Institute received the most backlinks (for a frame of reference, they used to publish daily, and now they publish 5 days per week — so they have a lot of content!). Four of the top ten posts are focused on research:
- The top post is a link to their annual study.
- The second post curates industry stats (another great approach if you don’t have the time or appetite to create your own research)
- The last two posts reported findings from two new studies.
To test a site you are interested in, try BuzzSumo’s Most Shared section. Look for words like “Research,” “Analysis,” and “Study” in the top performing content. You can also use Google Analytics to check the traffic to research content on your sites.
2. Research can help you get new clients
Perhaps there is no greater case study of research than this experience that Andrea Fryrear shared. As a bit of background, Andrea published her first research report, The State of Agile Marketing, earlier this year and was able to draw a direct correlation between the research and new client engagements:
”Our State of Agile Marketing has been a virtual goldmine for subscribers, backlinks and real money-in-the-bank clients. In our CRM I’ll see someone has downloaded the report, and within a couple of days (sometimes a couple of hours!) I’ll see that same someone requesting a call to talk about becoming a client. There is a clear correlation between reading the report and being ready to make a purchase.
3. It’s a source of more (and better) editorial ideas
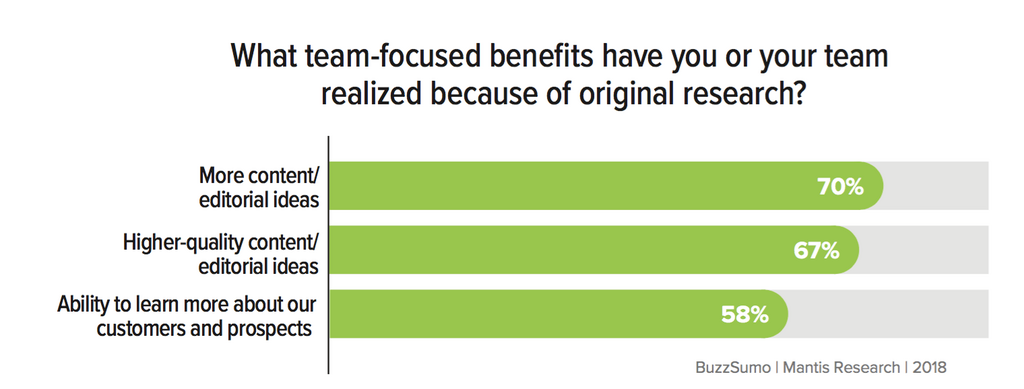
Your research can also effectively be a cornerstone of your editorial. Our research found that marketers who use research report both more and better editorial ideas as a result of their research.
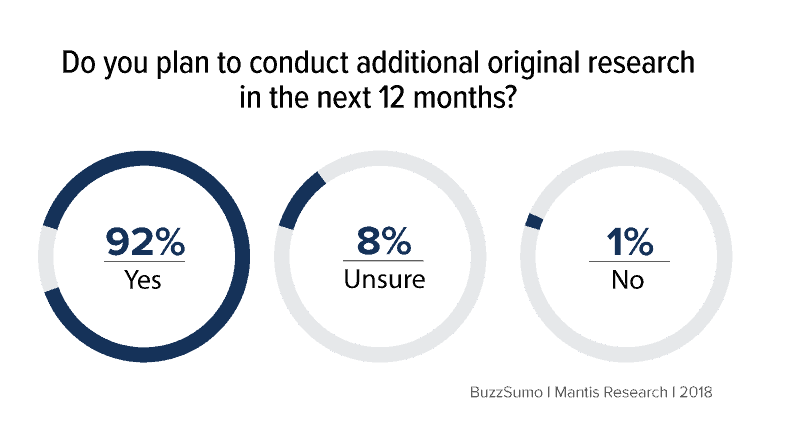
4. 92% of those who have used research plan to conduct additional research
Considering all of the above, it may come as no surprise that, even though research takes a substantial amount of time, 92% of marketers who have published research plan to conduct additional research.
What topic should my research focus on?
Once you commit to a research project, one of the first questions you’re likely to ask is what topic your research should cover. While the answer will depend, here are three “boxes” your research topic needs to check:
- It is interesting to your audience
- It aligns with your brand’s story
- It is a topic that has not already been covered
If you are in new space — or you are trying to create a category, consider creating a State of the Industry report. However, if you are in a crowded space, focus your research on a niche.
Not certain? Check out this advice from Steve Rayson as he describes if you should focus on the broader category or your niche.
How do I draft the right questions to get insightful data and create a story?
One of the most challenging aspects of the research process is survey design. If you are new to the idea of survey design, it is the questions you ask and, how you ask them.
On its surface, survey design seems simple, but many marketers I talk to struggle once they get the data back from their surveys. How will you use the data? What story does it actually tell? How can you use this to help people?
Surveys are most powerful when you have specific hypothesis you want to test — and you report on the actual results rather than what you want those results to be.
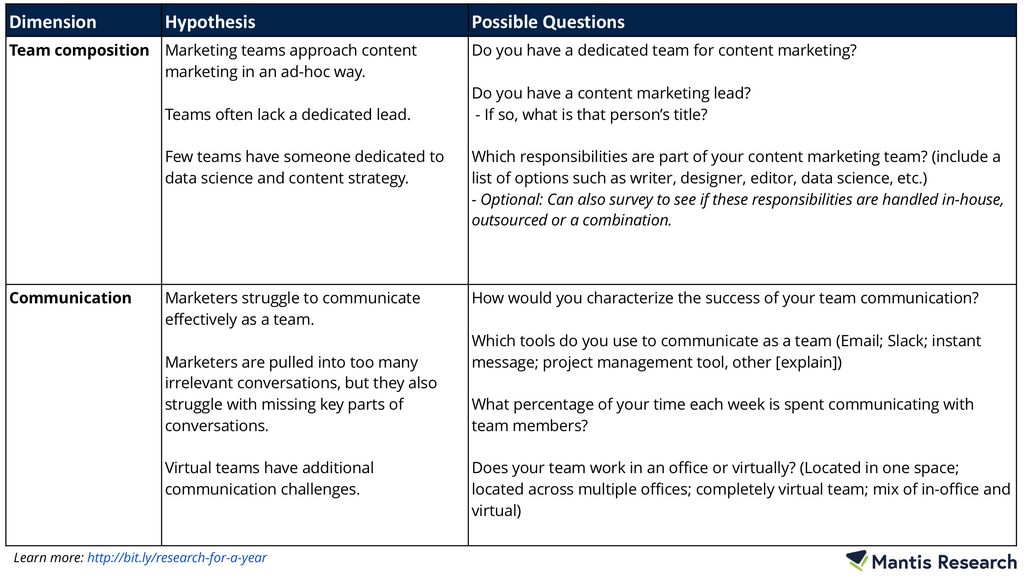
I recently shared and explained the framework I use to think through the story the research will tell — and get a year’s worth of content. You can read about the process in more detail on CMI, but here is a chart that lays out the three three things you need to document for your survey:
- Dimensions are the key categories you want your survey to cover. (You can think of this as your key categories or table of content).
- Hypotheses are your guesses for what the data will show. This is your story — both if the data proves or disproves this.
- Possible questions are the questions you ask to test your hypotheses.
In general, with the exception of demographics, if a question does not support your hypotheses, you likely do not need to ask it.
How many people do we need to survey?
This is definitely one of the top 3 questions I hear: How many people do I need to survey? Every survey requirement is different, but here are a few things to keep in mind.
Before sample size, look at “representation.”
If you’re studying “PR professionals,” for example, be absolutely certain you are recruiting exclusively from that group and that you have a diverse sample in terms of years of experience and size of company (among other qualities you want to consider). If you decide to study PR professionals, but recruit responses from an association for recent college graduates, your sample will be biased toward younger PR professionals. Be diverse or, at the very least, disclose how your sample may be biased. Representation is just as important as sample size, but often overlooked.
What’s my target sample size?
You can use an online calculator such as this one from SurveyMonkey to learn how many people constitute a valid sample size for your survey. To fill out the calculator, you’ll need to know the total population of your group (for example: how many PR professionals work in the United States). You will also need to know your confidence level (we typically use 95%) and margin of error (could be from 3 to 5%).
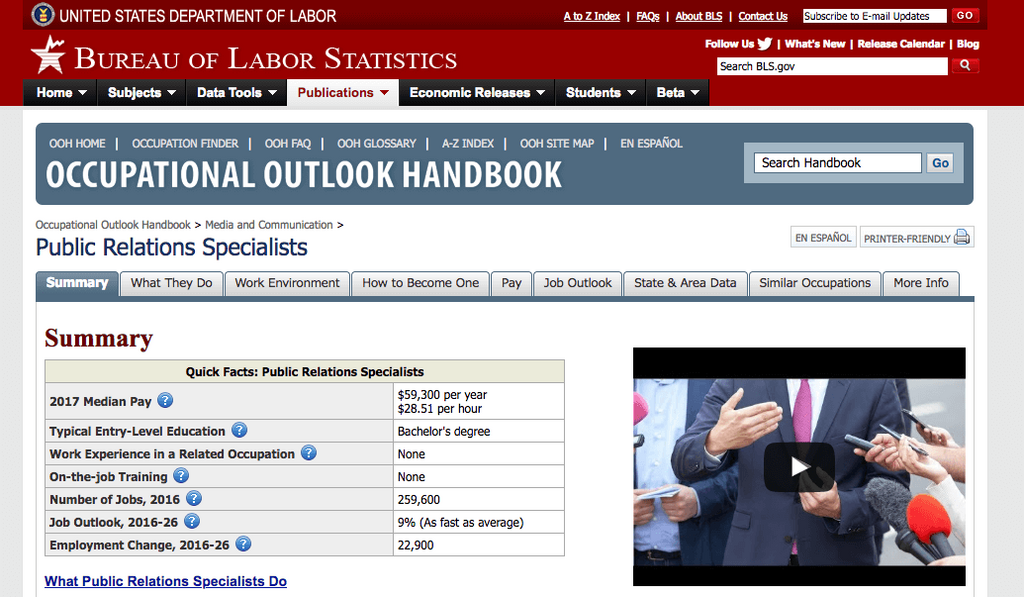
The Bureau of Labor Statistics is one source for this information in the US.
Here is the bureau’s summary for “PR Professionals.”
[Keep in mind that the higher the confidence interval, the larger sample size you will need; conversely, the smaller the margin of error, the larger the sample size you’ll need. For a detailed discussion about the topic, see Survey Monkey’s excellent review of these terms.]
Do you want to compare segments?
If you want to see how one segment compares to another (for instance, do those who live on the east coast vs west coast have different attitudes about something), you need to have enough people in both segments. The more segments you plan to compare, the beefier your sample size needs to be.
Are you trying to get media mentions?
If you want your research to get picked up by the press or influencers, a larger sample size typically gives the results more gravitas.
How do I get people to respond to my request to take the survey?
Getting people to respond to your survey is the top challenge marketers face with survey-based research. If you are struggling, check out these ten ideas. Many of them were tested or suggested by Gill Andrews when she conducted a recent survey:
- Create an easy-to-answer survey
- Send a dedicated email to your subscribers
- Find one (or more) distribution partners
- Offer respondents a toolkit or resource in exchange for completing the survey
- Record a short video asking for participation
- Reach out to people in your network
- Proactively ask people to be quoted in your research – and ask them to share your research
- Add a CTA to your thank you page
- Ask people in your email signature
- Use panels
How do I present the findings from my research?
As mentioned earlier, backlinks are a substantial potential benefit for research projects, but you need to structure your research so you get these backlinks. Choose ONE place where you will send all of your links about your research. I call this your home base.
There are many ways you can present your findings, but one approach that often works well is to publish a detailed blog post + SlideShare + gated resource.
Detailed blog post:
While your PDF report may be detailed–and you want people to download that–consider the creating detailed blog post as well (or, even instead of) because they are excellent for SEO. Hailley Griffis’s Buffer’s State of Remote Work and Andy Crestodina’s annual blogger survey are both great examples to study. Consider including elements such as:
- A datagraphic for each finding
- Influencer quotes
- Prescriptive advice for each finding
- A look at how various segments compare
SlideShare:
In addition to creating a blog post, consider publishing simple findings on SlideShare to get your research in front of new eyes. Other bloggers can also easily embed the findings into a blog post.
However, be aware that as of this writing, you are unable to replace your SlideShare at the same link if you notice an error or need to make an update. As such, triple check your document before posting!
If you want to see an example, check out the SlideShare Hailley included within her detailed blog post. In fact, she told me that publishing the SlideShare was one of the things she tried that (happily) surprised her. As of this writing, it has more than 33,000 views (up from 25,000 when I last looked at it a few months ago!)
Gated piece:
If your research is open-access but you want to use it for lead gen, create a piece of gated content that specifically addresses the gaps or challenges uncovered by your research.
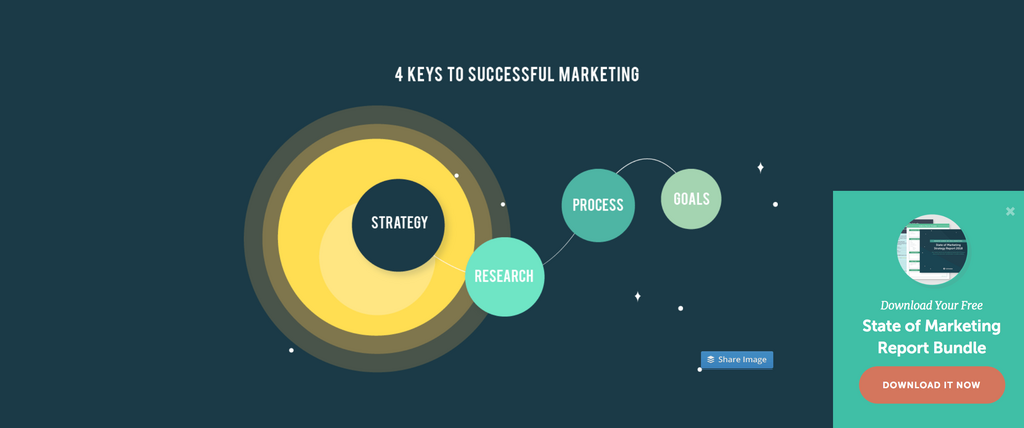
One great example of this approach comes from Co-Schedule who published the State of Marketing Strategy. Their landing page has a CTA to a State of Marketing report bundle that includes a strategy template, persona template, marketing plan template and a PDF of the report.
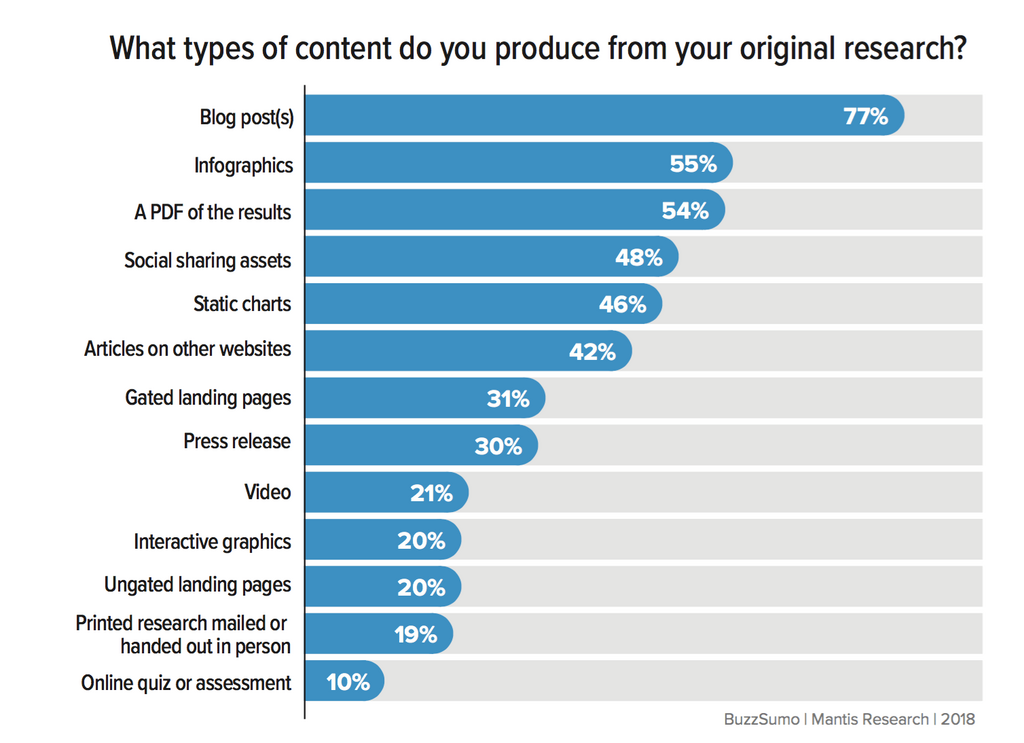
What kind of content can I create from my research?
While marketers are seeing a lot of success from their research, one of the biggest opportunities they have is to do more with their research. The chart below shows the various types of content marketers are creating from their research.
LEARN MORE: If you are looking for ideas and inspiration, check out these 13 ideas.
Check out our original research presentation here:
Original Research for Marketing: Answers to the Most Common and Challenging Questions from Mantis Research
Summary
Publishing your own research is an effective way to get attention and contribute valuable insights to your industry — but it takes a lot of work. My goal is to help you understand the process so you can be as efficient as possible — and get the best results.
What other questions do you have? Let me know in the comments!
Categories
Content MarketingCategories
Content MarketingThe Monthly Buzz⚡
Subscribe to BuzzSumo's monthly newsletter to:
Stay up-to-date with the best of the best in content marketing 📝
Get data-informed content, tips and tidbits insights first 👩🏻💻
Read top shared content by top marketing geeks 🤓
Try
Enter any topic, term or url to search to see BuzzSumo in action. It’s free!
100% free. No credit card required.
